


Google Ads data can produce valuable results when you use it alongside your SEO work. In this article, I want to share some of the metrics and data you can apply to SEO.
We use paid SEO tools such as Ahrefs and SEMrush because their data helps us make decisions. If we have already invested in Google Ads (Adwords) and PPC, and Google provides similar data, it makes sense to use that information too.
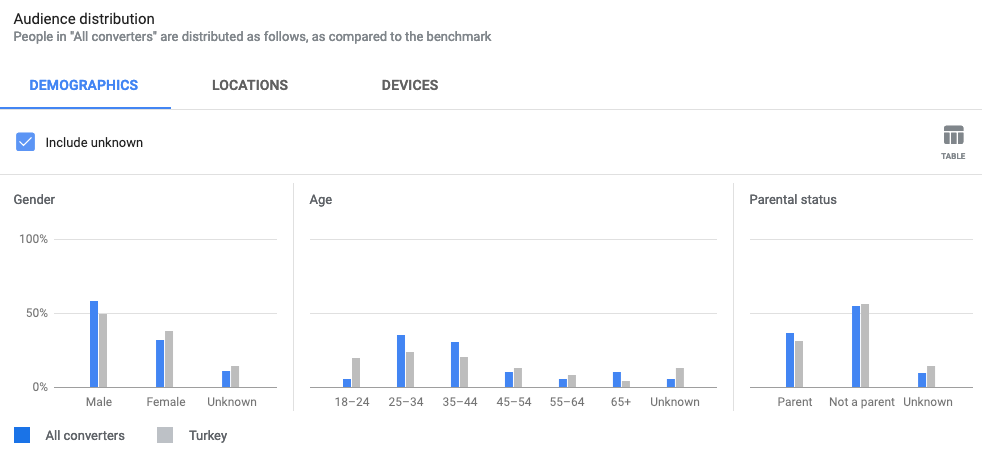
Before we begin, I should clarify that I will skip broad concepts such as “analyze your target audience,” shown in the image below, and focus directly on practical ways to use the data.
The Search Terms Report
The search terms report can reveal many terms that do not appear in your keyword analysis. For the ads you select, you can review the keywords, the searches they trigger, and the terms that ultimately bring users to your website.
If particular search terms have a high conversion rate in search ads, you can identify them and improve the relevant page around those terms.
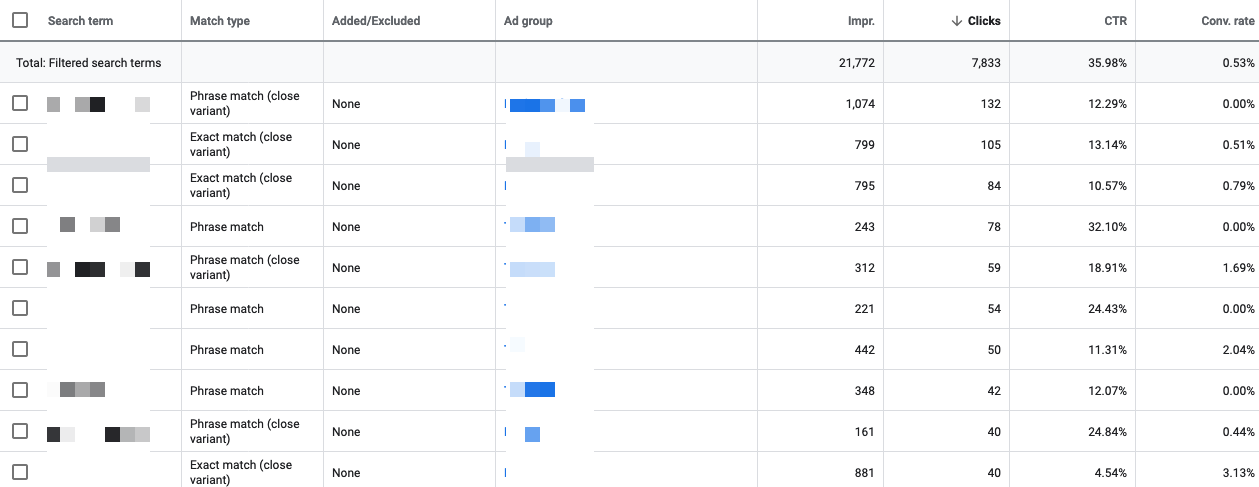
You can filter the table on the web page or export it in several formats. Use this data to identify terms with strong conversion rates and include them in your SEO work. Dynamic search ads may also reveal additional terms worth reviewing.
Some of these terms may also suit blog content rather than a commercial page. Look for queries such as ”what is“ and ”how to," then check their search volumes to find ways they could contribute to your website.
Direct questions in the search terms show that users are actively looking for those answers. If you can answer them, plan how to attract that audience organically and present the answers clearly on the relevant page.
Sample use;
Words That Bring No Conversion
You can also filter and analyze terms that cost a significant amount in Google Ads without producing any conversions.
For example, when I filter pages with more than 200 clicks, a cost above 200 TL, and fewer than 1 conversion, I get a table like the one below.
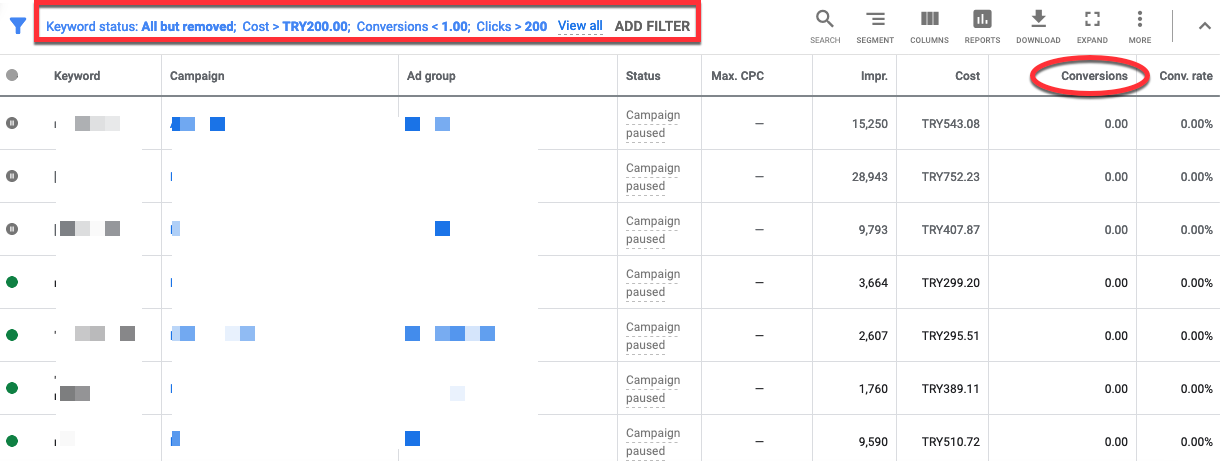
Based on this information, you can give these terms less attention in your SEO work and prioritize terms with higher conversion numbers in your plans.
Ads Title & Description
You can create titles and descriptions for Search Ads manually, then collect data about which versions improve CTR. For example, you can use the ad titles and descriptions with the highest CTR to inform the SEO title and description for the category you are advertising.
You can also test how CTR changes when a phrase such as “free shipping” is omitted from the titles.
I recommend testing your ad copy continuously, then using the results to shape the meta information on your website.
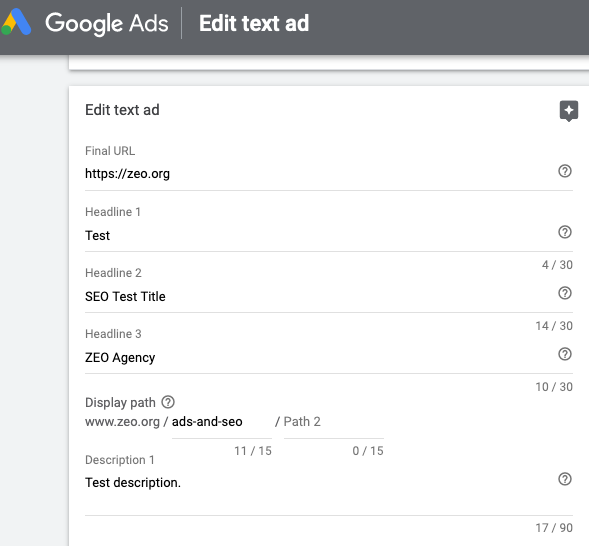
Suppose you are doing this for your /dress category. The search ad has been active for 1-2 weeks, so you now have some data. Find the ad copy with the best CTR and use it to update the title & description sections of the /dress category.
Always record the date when you add the change to the website. Then track the “Average CTR” metric in Search Console and analyze the result.
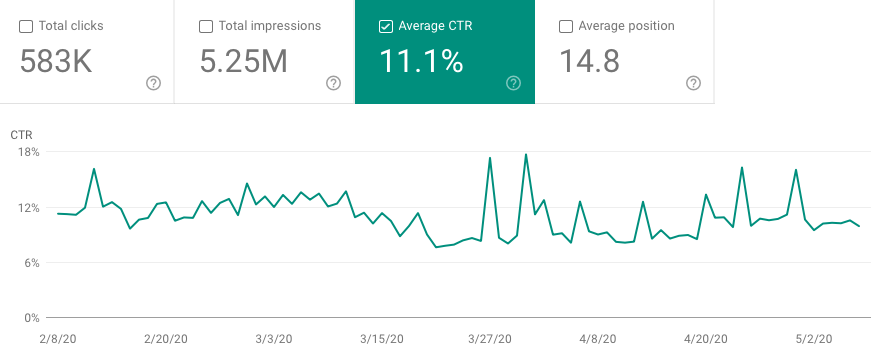
Locations
Google Ads location data can show you which regions generate the most conversions, helping you prioritize your SEO optimizations accordingly.
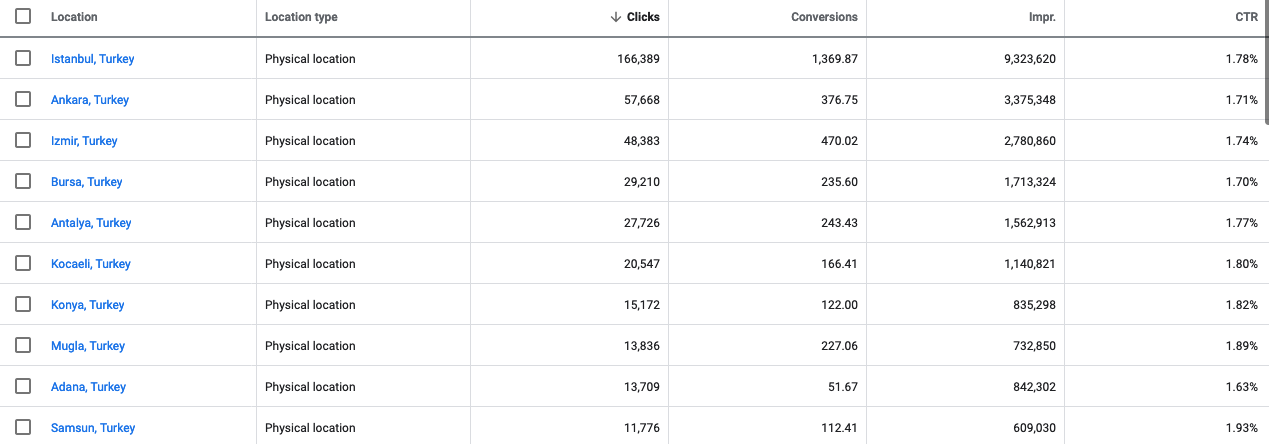
For example, imagine that you have a website selling "tickets" and want to improve the SEO meta tags and other elements across your location pages. Sort the locations by conversion number and begin with the strongest performers so you can use your time and energy more efficiently.
You can extend the same analysis to individual airports.

You can also analyze location pages with no conversions, if there are any, in Google Search Console and plan how to improve them.
Tracking the Trends
The Google Ads Keyword Planner Tool lets you set date ranges and see when a term is trending, including the device types used to search for it. Because trends were changing constantly during COVID-19, access to data from the previous month was especially important.
The image below, for example, shows the trend for the term ”bread maker" together with its device distribution. Researching and tracking similar terms with the tool can help you respond to changing trends.
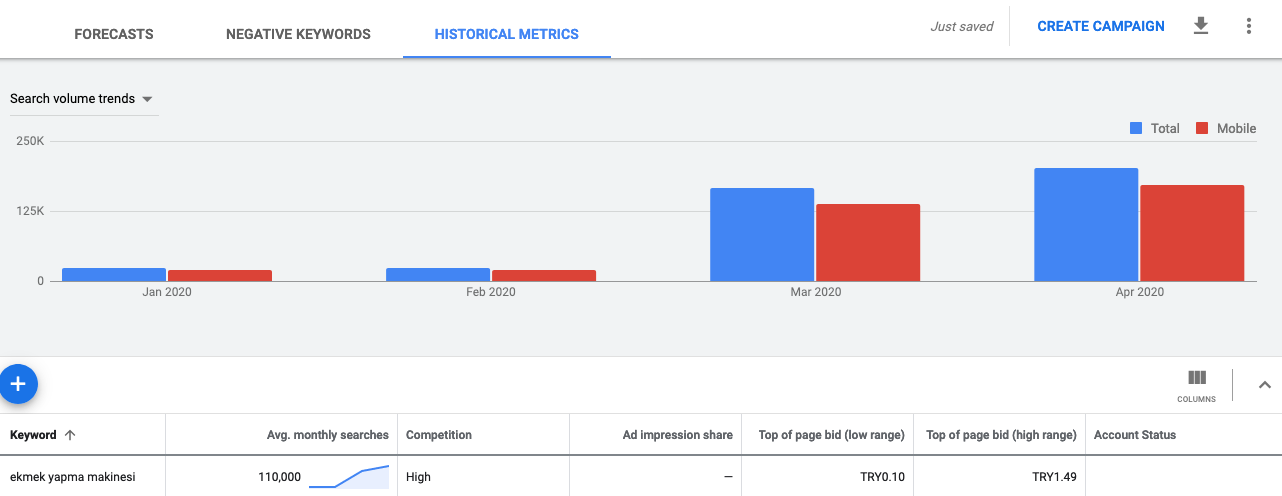
Beyond trend data, the tool also provides metrics such as "the average number of monthly searches for words" for free.
Display Campaigns
Display campaign reports show the other websites where your ads appear. From this data, you can identify sites that appeal to your target audience and generate conversions, giving you a starting point for outreach.
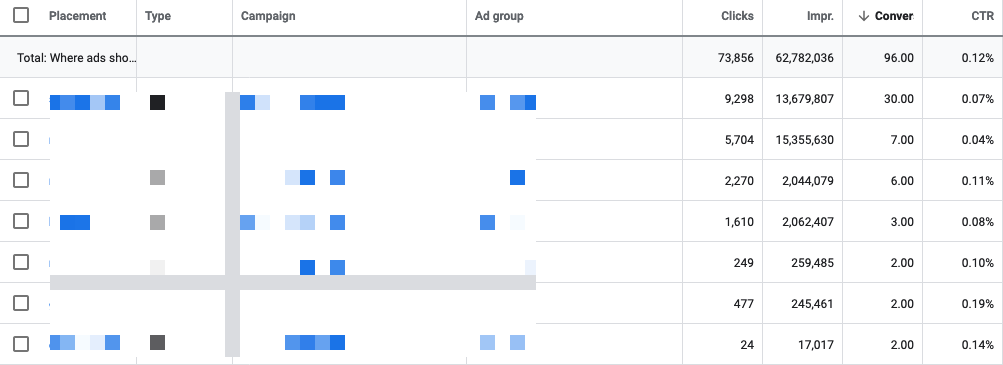
You could also create content that attracts this audience organically to your website. When preparing that content, make sure you follow Google's suggestions.
Google Merchant Center
When you upload a feed to Google Merchant Center, Google scans your products and reports the errors and warnings it finds. Logically, if a product image is invalid, it is difficult to persuade organic visitors to buy the product, let alone generate conversions through Google Ads.
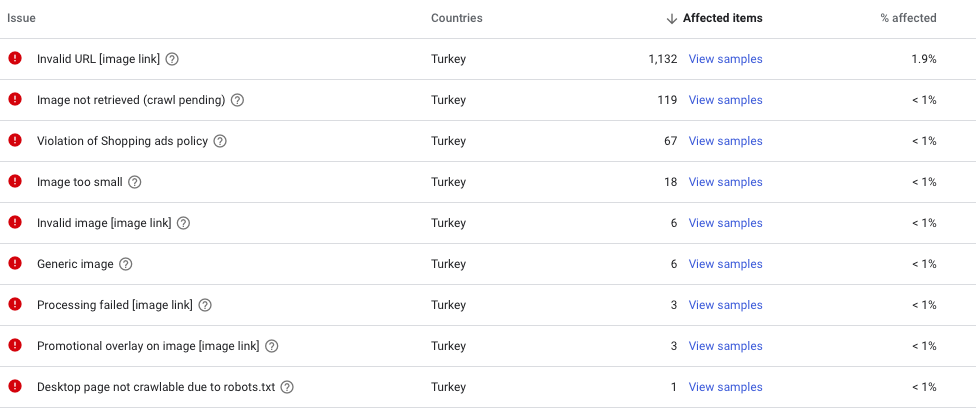
In the example above, I can see that more than 1.000 products on my website have images with invalid URLs. The report also helps me identify images that contain promotional overlays or are too small. I can then decide what to fix to give Google a more suitable website structure.
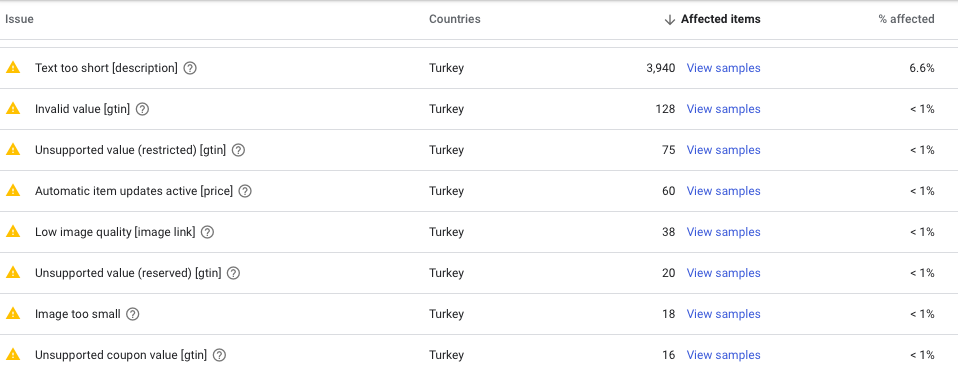
You can think of these findings as similar to the warnings section for structural data, which reports warnings alongside errors. I can see that a product description is too short or that an image has quality issues, then quickly build an action plan around those findings.
When you inspect the details of products uploaded through the feed, you can identify the specific product with an error. A single product may have several errors.

Merchant Center can show you these errors without a crawl or, for a site with many products, before the crawling process has finished. This was a particularly useful feature in 2020, when information about image quality was largely absent from SEO tools. Google also made an update to how products appeared in shopping results.
(Bonus!) Best Seller
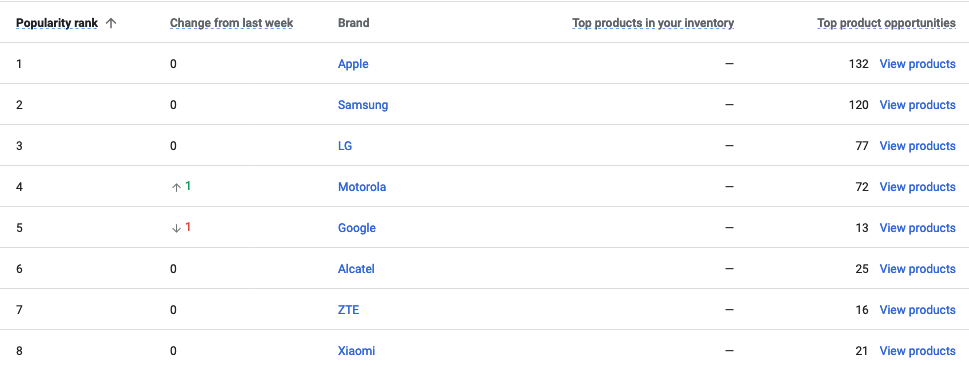
The Best Seller section is another Merchant Center feature that provides useful data by listing the best-selling products. It was not supported in Turkey at the time, but businesses serving foreign markets could use it to follow the market.
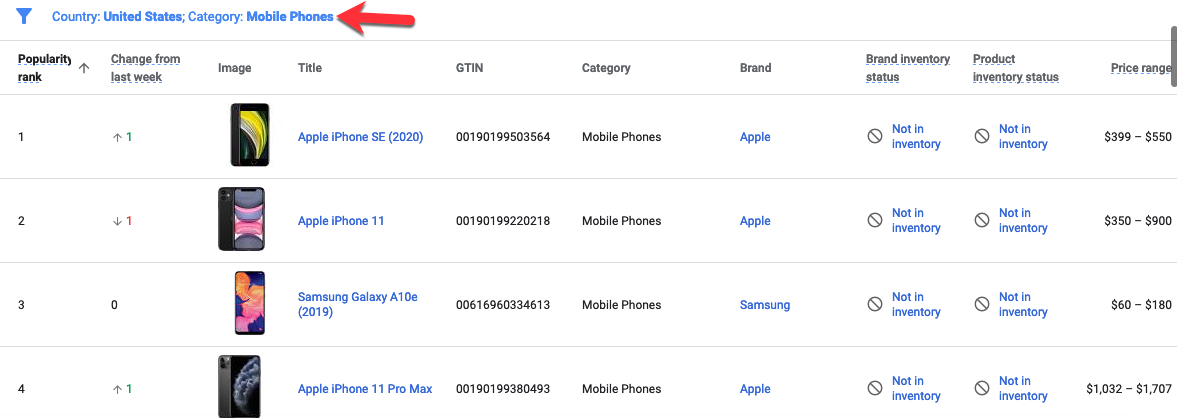
One of its strongest features is the ability to break categories down to the lowest sub-category and view the best-selling products in each category for free. The brand section also shows the best-selling products for each specific brand;
That's all :)
As I reach the end of the article, I highly recommend Utku's article on Google Ads campaigns, which he prepared with R.
I wish everyone days full of data ahead!


