


There are lots of tools out there that let you measure your website's load time. GTmetrix and Pingdom are some of the most widely used tools for load time measurement. These tools suggest useful ways to boost your website's speed, and SEOs use them to find improvement opportunities. Here, I am not going to talk about how you can use these tools to achieve better results, but instead, I will tell you how you should measure your load time. If you want to calculate these for yourselves, a simple spreadsheet is all you need: put your fully loaded time measurements in a column and apply the Mean and Stdev functions to it.
Nature of the Measurements
As a course of its nature, measurements have to be repeated both on a regular and random basis. Regularity lets us be sure we are recording the true nature of the system we observe, and randomness lets us be sure we are not fooled by periodicity. Think about a barber shop: if you always visit it on weekends, you might think barber shops are always busy places, but most of the time during the weekdays they're not. Now, let's go back to the site speed testing tools.
GTMetrix Results
When we make a couple of tests on the same website from the same location with GTmetrix, we can easily see the calculations differ significantly from each other. Here I want to show you a couple of results:
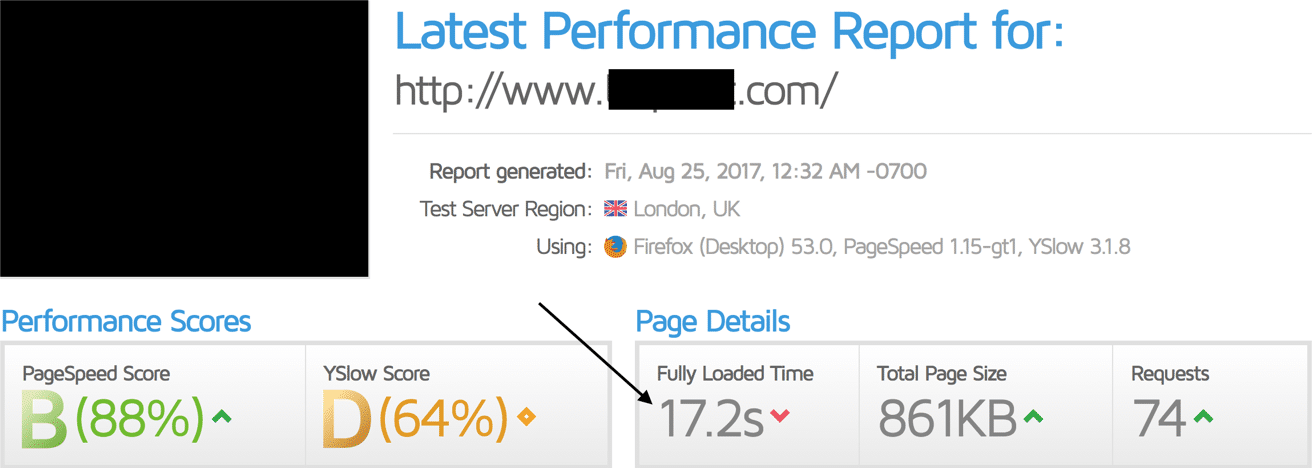
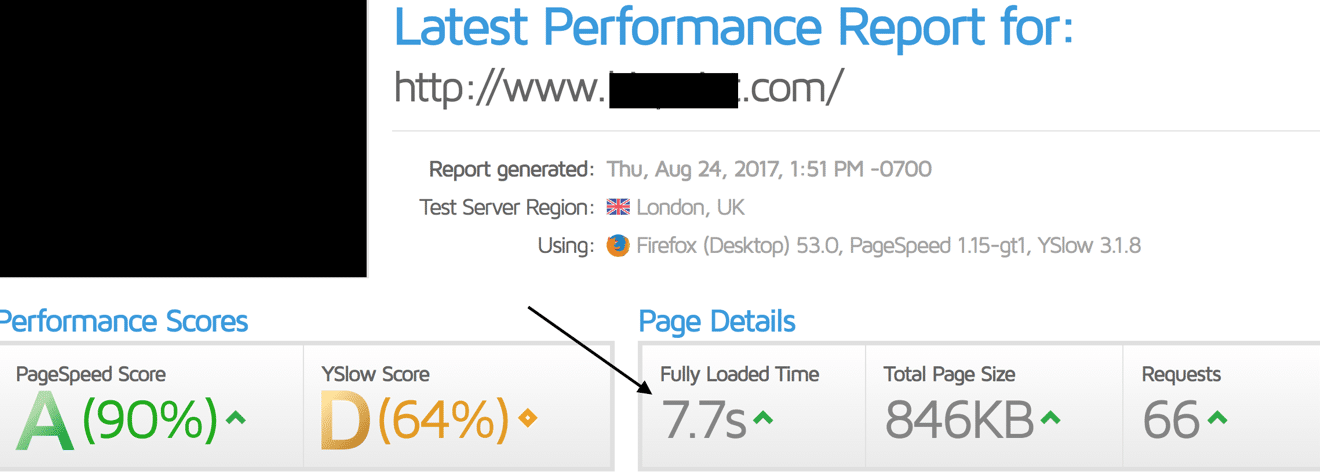
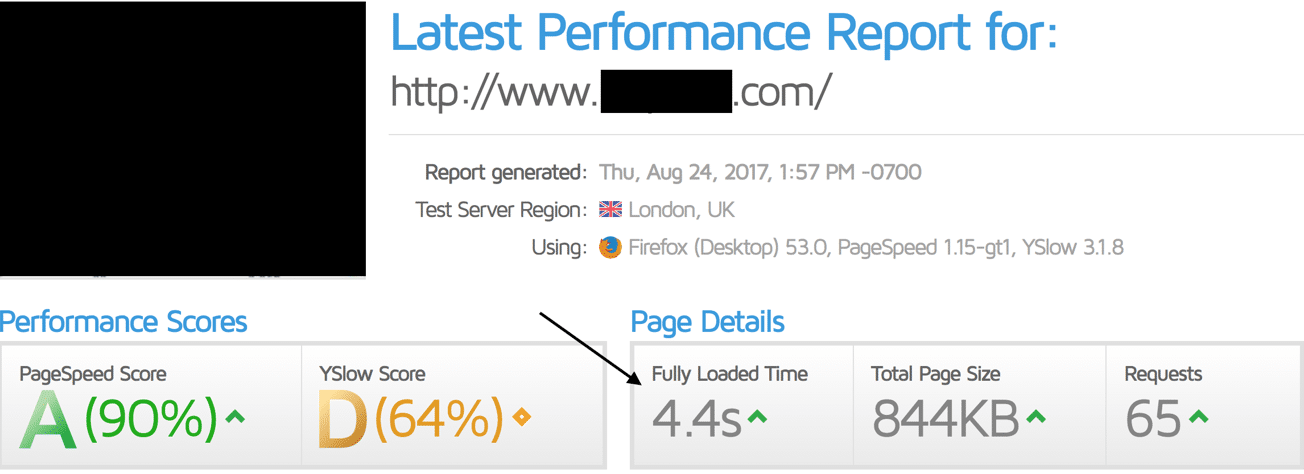
So our measurements are: 7.7, 4.4 and 17.2. From these calculations, a couple of questions arise:
- Which one is my true fully loaded time on the GTMetrix scale?
- If I take the mean value of these three calculations, will I have the exact fully loaded time? (nearly 10)
- If I take three more calculations, will they differ from the previous ones? If so, by how much?
- Is the 17.2 value a one-time thing, or will it repeat?
We can expand these questions and try to guess our real loaded time, or we can repeat our measurements and use the confidence interval to obtain the most reliable mean value.
Mean and Confidence Interval
When we repeat our measurements we start to understand the nature of the system better. We can see whether the values are discrete or continuous, and whether the calculations change through time or not. Most importantly, we can lower our confidence interval towards the mean and get closer to our true mean value. In this example, measurements are made from Vancouver, Canada, which is the default location. Let me show you how I calculate the true fully loaded time mean value for this website: first I measure the fully loaded time for this website 16 times randomly during the day.
>loadedtime <- c(5.4,8.1,3.9,4.5,6.2,4.3,4.8,17.4,8.5,4.1,4.7,5.4,5.0,5.1,8.8,5.5)
Then I calculated the mean, standard deviation, and confidence interval values for these measurements. You can use Excel-like software for all of these calculations. In Excel, the Mean and STDEV functions will help you to calculate. Mean value = 6.35625. Confidence interval = 1.960 * STDEV(loadedtime) / sqrt(n) = 1.62777. So these measurements mean our mean value is between 6.35625 ± 1.62777; 4.72848 and 7.98402. Not as accurate as we desired, so keep measuring. When we reach up to the 100th measurement, we can check the mean and confidence interval again. 100th Measurement: Mean value = 7.52. Confidence interval = 1.06173. Here we have a lower interval, 7.52 ± 1.06173. Our true mean is between 6.45 and 8.59, we can keep measuring and lower the interval, but for now, that is enough, you get the point. Here we can also see the interval is shifted: the 4.72 mean value we calculated from 16 samples is no longer the case. From the measurement I made, I can easily say that values over 15 are repeating themselves. You can see it in this graph:
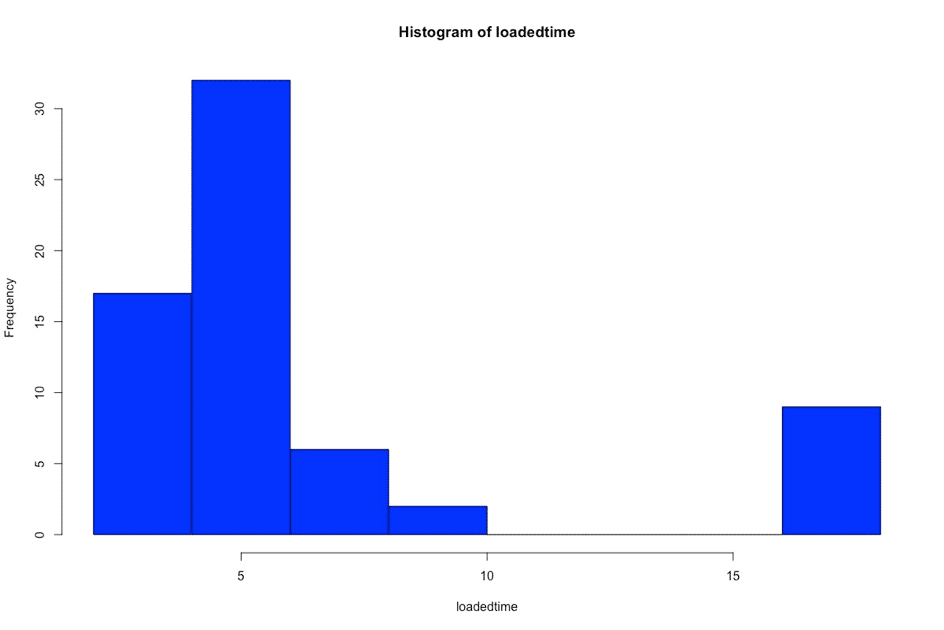
Note: Fully load time distribution: we measure fully loaded time mostly below 10, but we also record some values above 15 with almost none in the middle, which may point to some kind of problem whose source we don't know. This gives a much better picture of your fully loaded time. So why did the mean value increase? Because when we observed 16 values, we hadn't been able to observe the behavior of this website completely. After 1 or 2 days of measurements, we get the real picture here. Vancouver or London?
The next question that popped up in my mind is: the server location of this website is probably closer to London. So will the mean value differ from location to location? The answer lies in the mean and the confidence interval again. When I calculate the mean and interval from 16 measurements from London for this website: Mean value = 6.18125. Confidence interval = 1.960 * STDEV(loadedtime) / sqrt(n); = 2.127653. So this means our mean value is between 6.18125 ± 2.127653; 4.053597 and 8.308903. 100th Measurement: Mean value = 6.869. Confidence interval = 0.9071042. Here we have a lower interval, 6.869 ± 0.9071042. It looks like London calculations have lower results than Vancouver, but this sample rate is not enough to exactly say London has a lower mean value, because both of their mean values sit inside each other. Increasing the sample rate, we can solve this issue, and most probably we can see that London has a lower fully loaded time.
Final
When you want to know the fully loaded time of your website for sure, you need to use the mean value and confidence interval. The confidence interval tells you how accurate your mean value is. You can also consider using GTmetrix or Pingdom Pro to record your URLs on a regular basis to understand their true loaded time. I know even basic statistics can look complicated, but if you want to measure your loaded time correctly, you need to follow this process. Feel free to ask me anything about this.


