


Hello dear ZEO followers, in this article, we will share information about how R Studio actually makes our lives easier in SEO and how it will help us when pulling data from Google Search Console. Before we start pulling data with the API, I would like to explain the setup of R and a few simple settings, because without understanding what they do, the code alone may not be very useful.
Why R?
- It is a more interpretable language than the C family and languages like Java,
- It proceeds in an interactive way (such as running relevant pieces of code),
- Unlike SPSS, there is a chance to intervene in the code structure and it is completely free of charge,
- It is very effective in interpreting the results of data processing and statistical analysis.
In SEO, we can use it to collect keywords and pull more data and use it for both visualization and statistical interpretation. When you enter Google Search Console through the browser, you can pull up to 1,000 lines of data at most. With the API, you will have as much data as you want.

Installation and General Settings
Download the relevant program from R Project's download page and then install R Studio below.
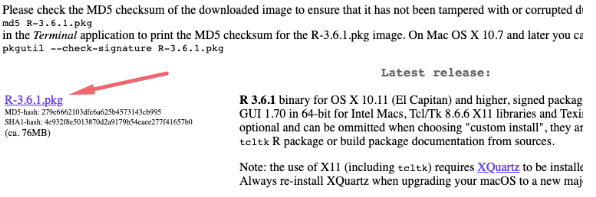
We need to install R Studio program together with R Project;

First, start installing R Project by clicking through the default install prompts. Then install R Studio and complete the process. The icon should appear on the desktop.
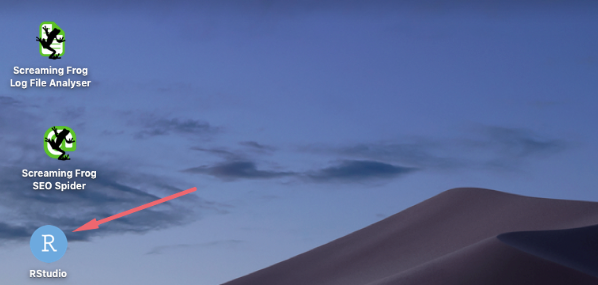
The installation is complete, now let's customize the application, shall we? You can completely change R's interface (colors, fonts, etc.) by following the steps on the screen.
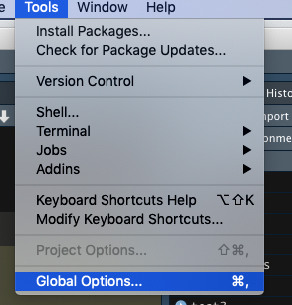
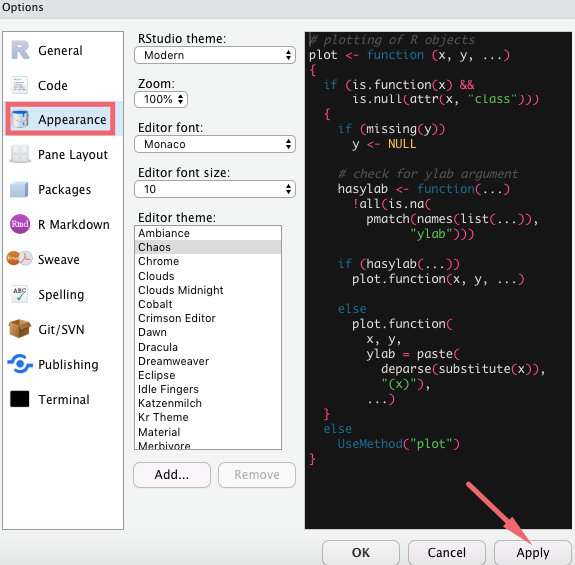
I usually prefer to use black tones because the white color is very tiring for my eyes. Go to the “Appearance” section, set the theme and other adjustments and save your settings with Apply.
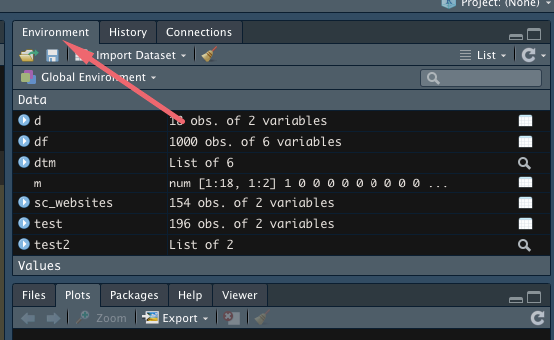
The “Environment” section on the right side of the Dashboard is the section where the variables or objects we write are kept. From here you can also add Excel or text files using the “Import Dataset” option.
Libraries are used for different purposes, so this is actually the most used section. If there is a check mark next to the library name, the library is active.
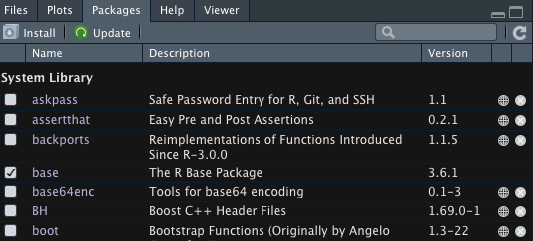
You can download and install the new packages by clicking the “Install” button. Since clicking through the interface gets tedious once you have hundreds of lines of code, we can also install these libraries by writing code as a second way. As soon as you start writing code, R already shows you what kind of structure to use, just like in Excel.
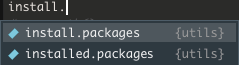
install.packages("dplyr")
Then we add the following code to call this library;
library(dplyr)
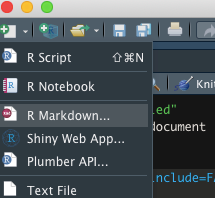
To add a worksheet, you can do as shown in the image below. I use R Markdown in my work, you can also choose this (optional)
You can also use Alt enter or CMD enter to run all the typed code.

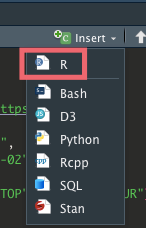
To write our codes in Markdown format, expressions called “Chunk” need to be entered and we write our codes between them. A sample usage is below.

To add a new chunk to your working environment, you can do the following.
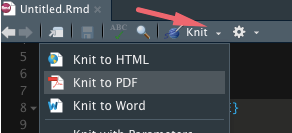
You can do the following to export your codes as well. Your codes must be running when exporting.
If you write simple and clean code, it will not only make your code more readable for others, but it will also make you less confused when you go back to it. After giving some basic information, let's move on to the part that will be a bit useful, because R has a lot of features and a lot of code.
Connecting to Search Console with R
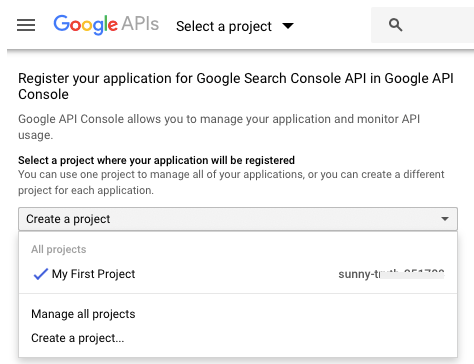
You can learn more about setting up the API in Google's article on how to connect to the Search Console API here.
In R, we first need to download the “SearchConsoleR” library.
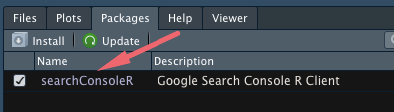
To do this, go to “packages”, click on Install and install the relevant package;
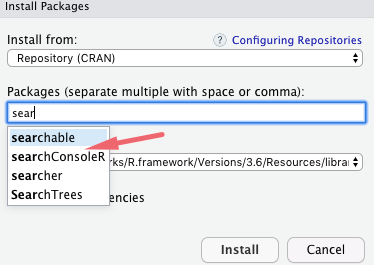
It's done, our package is installed.
Let's write our first code; (while writing the codes, I will give both the screenshot and the codes openly for better understanding)
library(searchConsoleR) scr_auth() sc_websites <- list_websites() default_fetch <- search_analytics("https://zeo.org/")

What did we do here?
First, we loaded the (searchConsoleR) library, started connecting to the API with scr_auth(), told it to list all the sites with list_websites(), and asked it to find the ZEO property among them and do it with search_analytics().
When you run this whole code block, follow the steps below with the CMD Enter shortcut. When you install the API package and start the connection, it will ask you for permission. You must log in with the account of the site in Google Search Console.
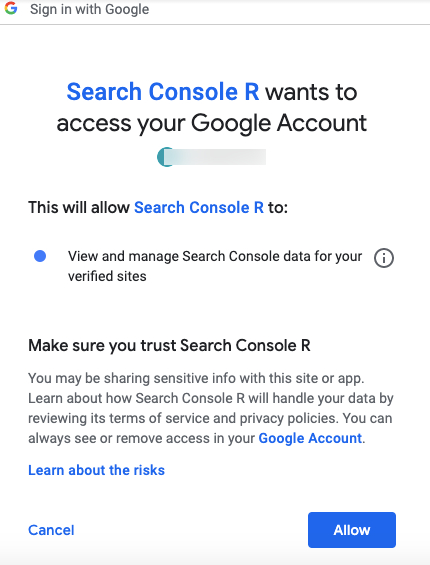
Copy the code that comes to you as below and return to R. On Windows devices, I think it returns to R automatically when you switch back.
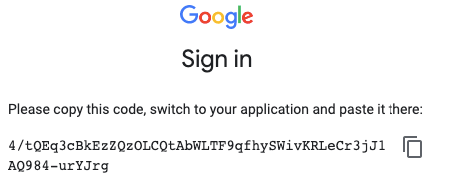
Paste this code where you see it in the picture;

We have established the API connection! Then add the following codes;
df <- search_analytics("https://zeo.org/", start = "2019-10-01", end = "2020-02-29", dimensions = c("query"), dimensionFilterExp = c("device==DESKTOP", "country==TUR"), searchType = "web", rowLimit = 10000)
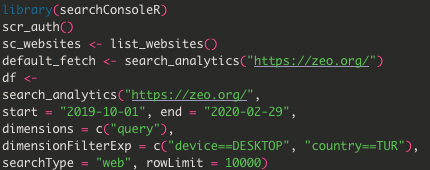
What did we do here?
We created a data frame called “df” and assigned all these rows to it. We pointed ZEO to this df with search_analytics and told it which date range to pull using the start and end dates. I set the date range starting from the 10th month; you can pull whichever date range you want. In the “dimensions” line, I specify the query keyword to get date-specific data. With “dimensionFilterExp”, we selected desktop searches as a device and asked for only users from Turkey. If you have a multilingual structure, you can get the data by entering the code for that country here.
You can access the codes of the relevant countries here. If you want to change the device, just type TABLET. With “searchType” we only wanted web searches. If you only want data from videos or images, you can use “video”, “image” commands for this field. In the rowLimit section, you set the limit, that is, how much data you will pull.
I limited it to 10000 to make the process shorter. You can use a different number. If you do not want to filter in the “dimensionFilterExp” section, you can pass this section with NULL. Let's write the following codes to establish more accurate communication with the API;
batching <- search_analytics("https://zeo.org/", start = "2019-10-01", end = "2020-02-29", dimensions = c("query"), searchType = "web", rowLimit = 10000, walk_data = "byBatch")
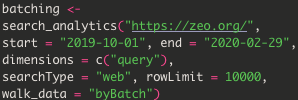
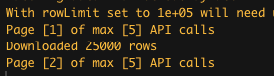
Data will start to be pulled from the API;
Now it's time for the most enjoyable part, getting the results, and we can do this with a single line of code.
write.csv(df, "samet.csv")
Final version of the code;
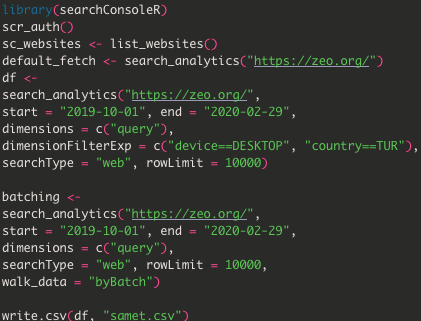
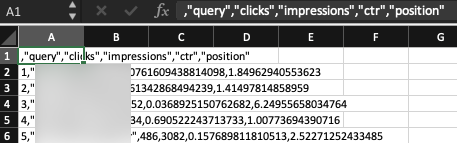
With this code we download the SC data to our computer as .csv. You can change the name “samet.csv” to whatever you want. Use your computer's file search to find it, that's all. The file I obtained with the API using R;
After that, you can make all calculations on the relevant data and use these words in different marketing channels.
Visualizing Search Console Data with R and Some Statistical Calculations
I will show you how to use very simple statistical commands. You should definitely install a library (ggplot) which is a must for graphs. According to the date range I have specified, you can make a graph on words with a position less than 10 and a click count greater than 20. I add the following code at the bottom of the existing codes we added above;
abc <- df[df$position < 10 & df$clicks > 20,] ggplot(abc, aes(position, ctr)) + geom_point()

The graph after running this code is shown below;
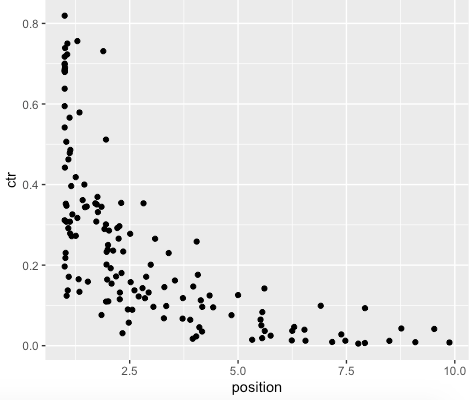
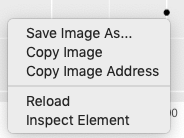
You can find many types of information and code related to graphics at this address. You can learn how to use them by experimenting. You can also export an image in R very easily by right clicking on the image.
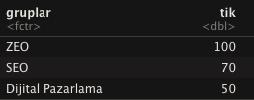
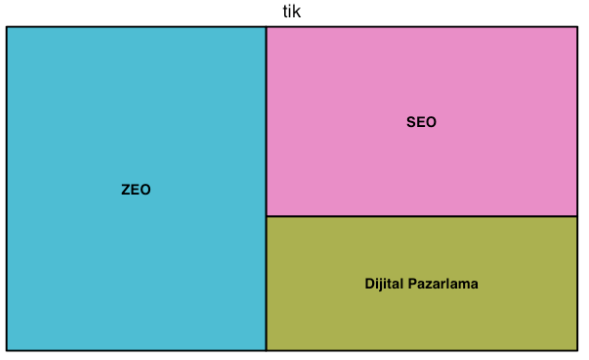
You may want to create another example treemap. With the code below, I have indicated that the word ZEO, for example, occurs randomly 100 times in this dataset and the word SEO occurs 70 times. I have also grouped the total number of clicks they received as “ticks”.
df <- data.frame( gruplar = c("ZEO" , "SEO" ,"Dijital Pazarlama" ), tik = c(100,70,50))

When I run the code;
In addition to these codes, when I run the following code after downloading and installing the treemap library;
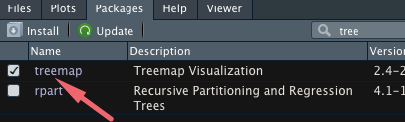
treemap( df, index = "gruplar", vSize = "tik" , type = "index")

The graph will follow;
 If you want to draw a histogram, you can use the code below. We created our data with “abc” by filtering it in the section above.
p1 <- ggplot(abc, aes(ctr)) p1 + geom_histogram(binwidth = 0.2, colour ="black", fill = "orange") + ggtitle("Histogram Grafiğim")

Histogram plot by CTR;
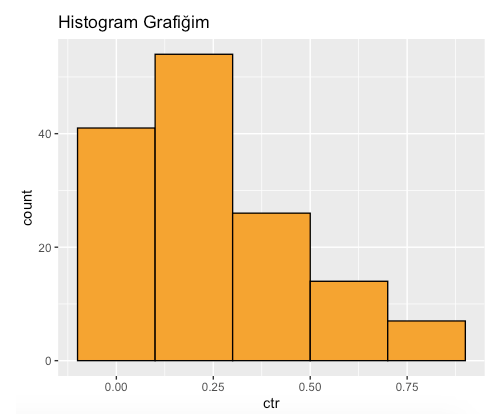
“ggtitle” allows us to add a title to the chart. With head(df) I can see the rows and columns one by one in R without opening the .csv.
head(df)
Output;
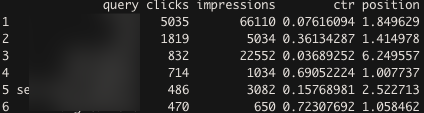
You can also use the following command for simple basic statistical information;
summary(df)

For example, I can learn here that the average number of clicks is 2.16. Again, it is possible to see min and max values. In a different way, I can use profiling_num(df) to learn my values such as standard deviation;
profiling_num(df)

In the data above I can also see my p values. In order to use the profiling_num code, please activate the following library;

I can enter the following codes to learn my row and column numbers;

Because I said 1000 rows when connecting with the API. It shows that my column count is also 6. I can also see the variables with colnames(df);

Failure to install or activate the libraries may cause you to get an error when running the code.
I strongly recommend reading Utku's article on how Google Analytics can be visualized with R. Hope you enjoy data sets with R :)
Useful Resource(s);


