


Google announced in recent weeks that the current version of Universal Analytics would be retired on July 1, 2023. The announcement prompted many site owners and consultants to start using GA4 and explore Google's new tool in more detail. In this guide, I will explain how to find the measurements that matter for SEO on the Google Analytics 4 report screens.
Home Report
As you know, GA4 opens with a "real-time" report experience that differs from the familiar Universal Analytics version. There are many new details to explore, but because this article focuses on SEO performance, we will leave most non-SEO details aside.
When you first open GA4, the "Home" screen appears. It presents a summary of several metrics.
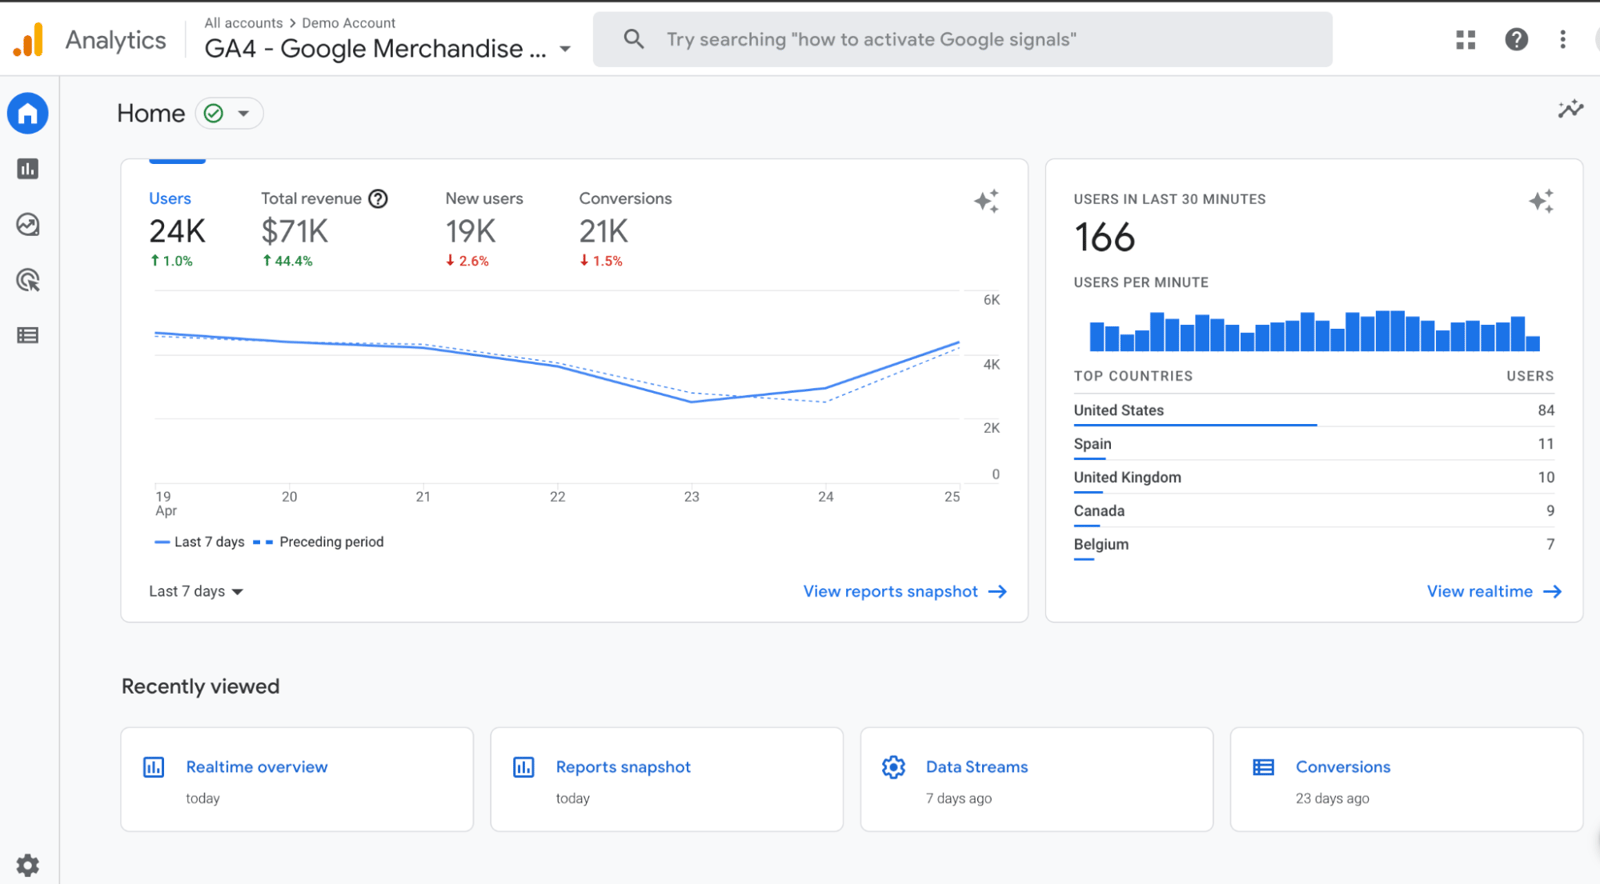
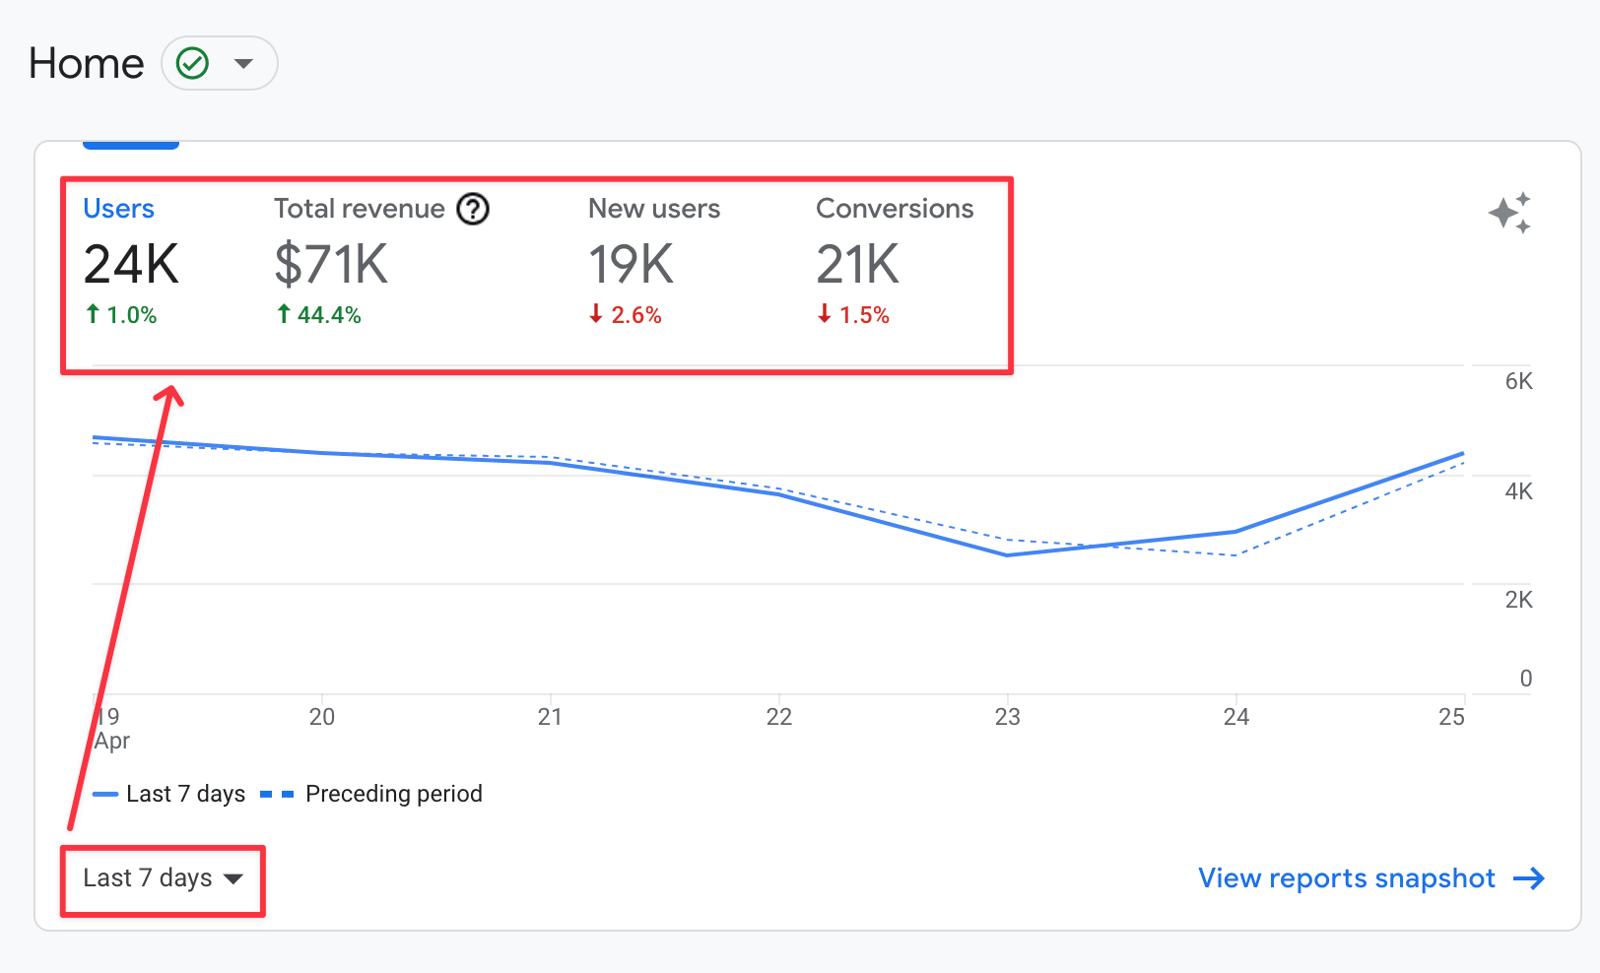
On the left, we see a line graph and several numerical metrics. On my screen, these are users, total revenue, new users, and conversions metrics. The interesting point is that this section changes according to your behavior in GA4. For example, the "Total revenue" metric would not appear here for a site that is not an e-commerce site. We can also change the time period in the field below. GA4 automatically compares each selected period with the previous equivalent period and shows the percentage change.
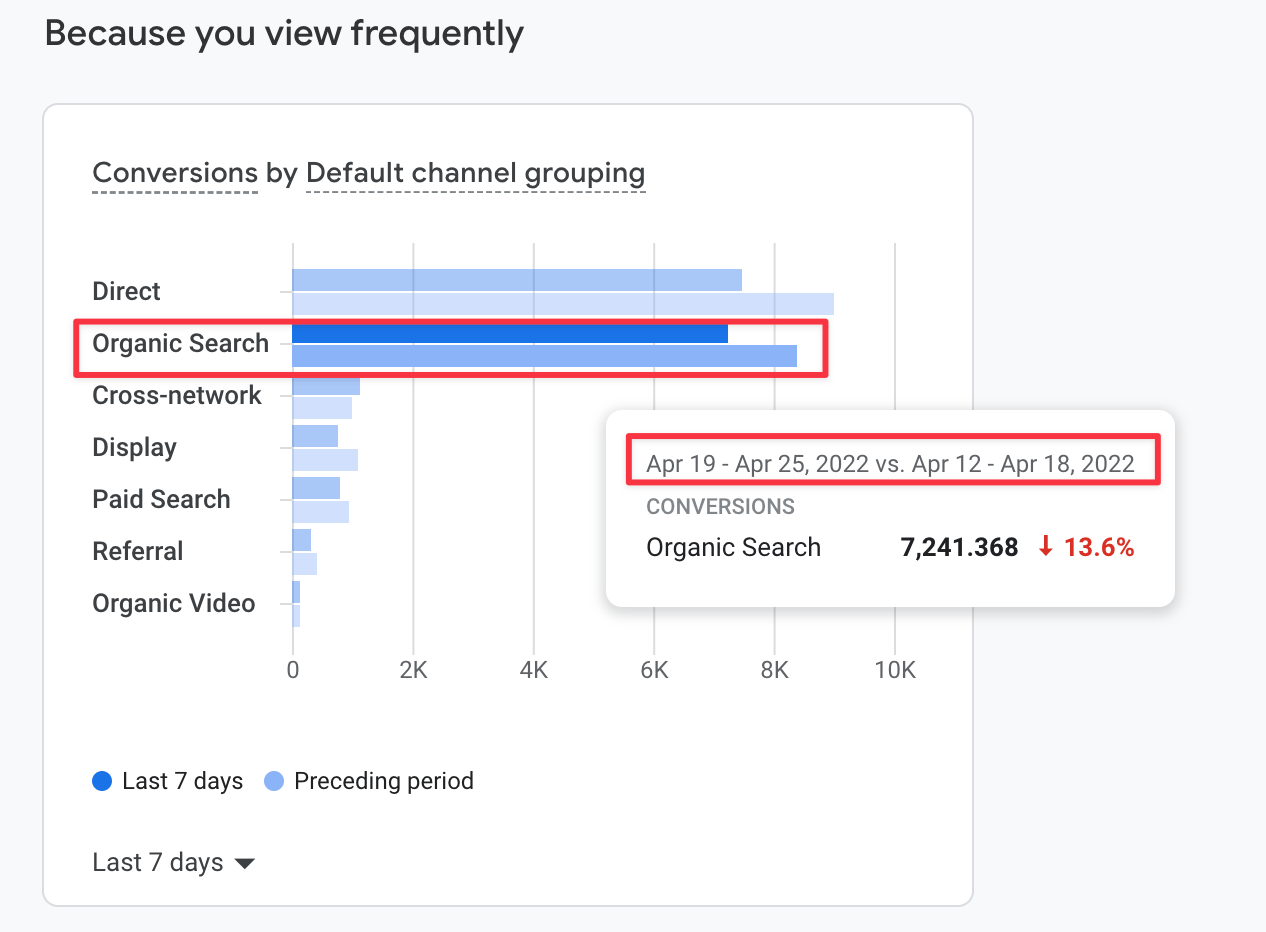
When I scroll a little farther down the same screen, I see another personalized graph showing my conversion performance by channel. GA4 shows me this graph because I view this report frequently. As mentioned above, it also compares the selected period with the previous period automatically.
Real Time Report
We use this report to track site traffic in real time. It shows the number of visitors from the last 30 minutes and provides details about them. To open the Realtime screen, follow Reports > Realtime in the left menu.
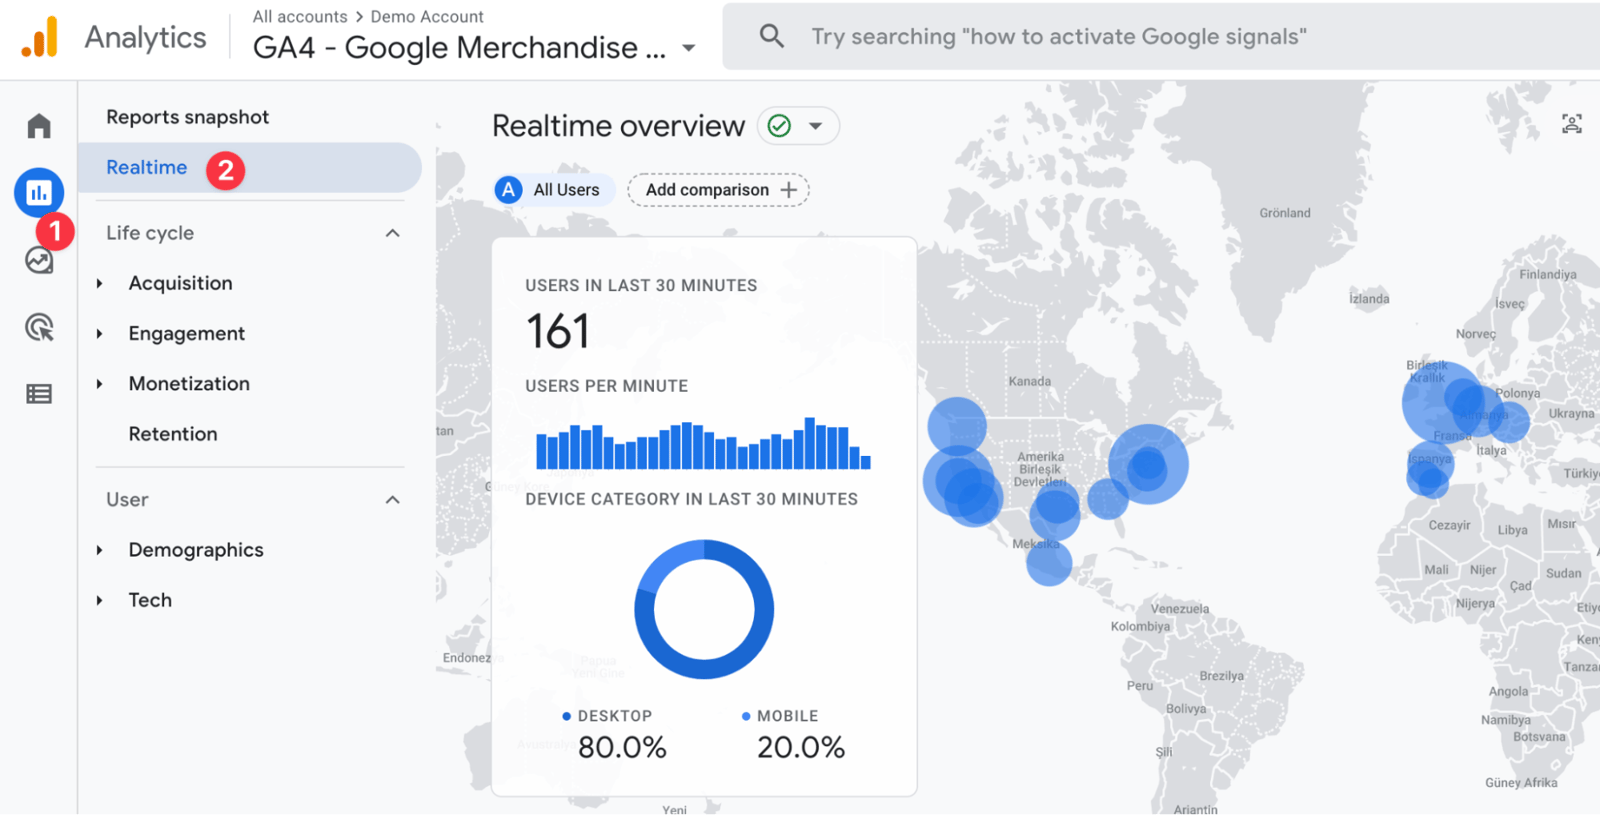
For SEO, the most important section of the real-time report is the source data for users who visited your site for the first time within the last 30 minutes. You can find it farther down the report.
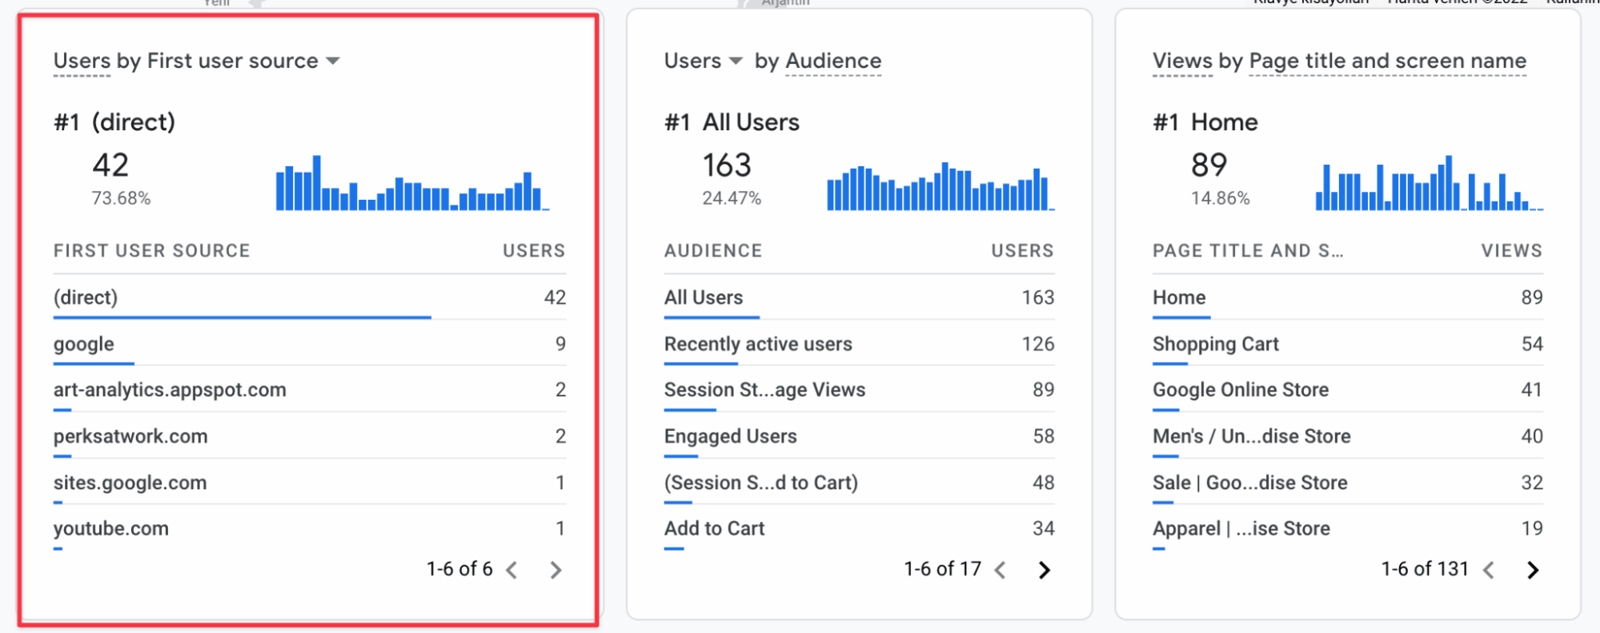
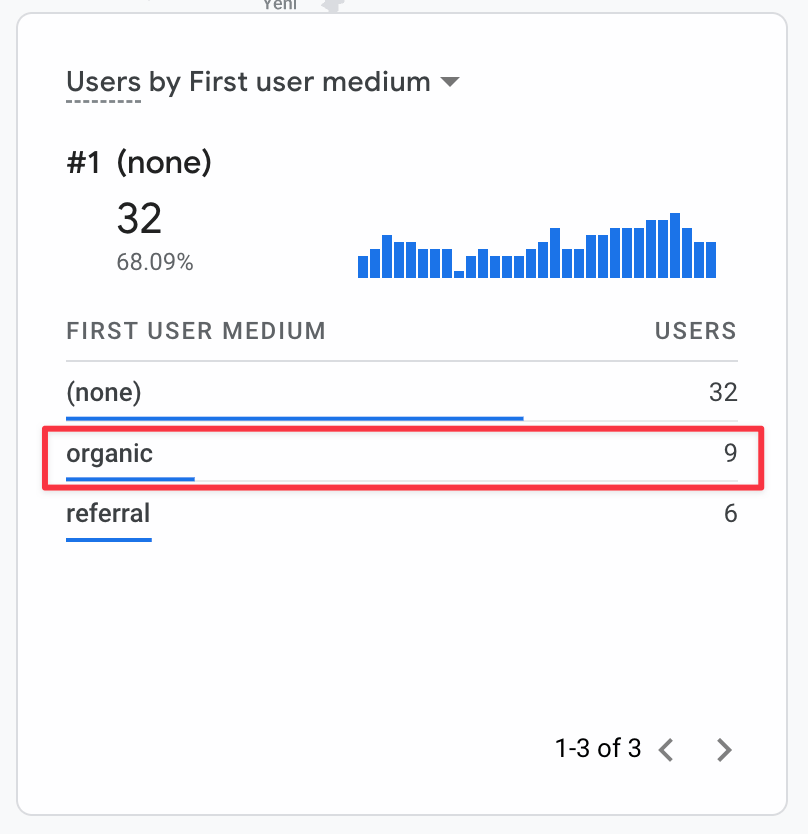
Click the source on this report card and select "medium". As shown in the screenshot below, you can then see how many first-time visitors from the last 30 minutes arrived through "organic" traffic.
Acquisition Overview
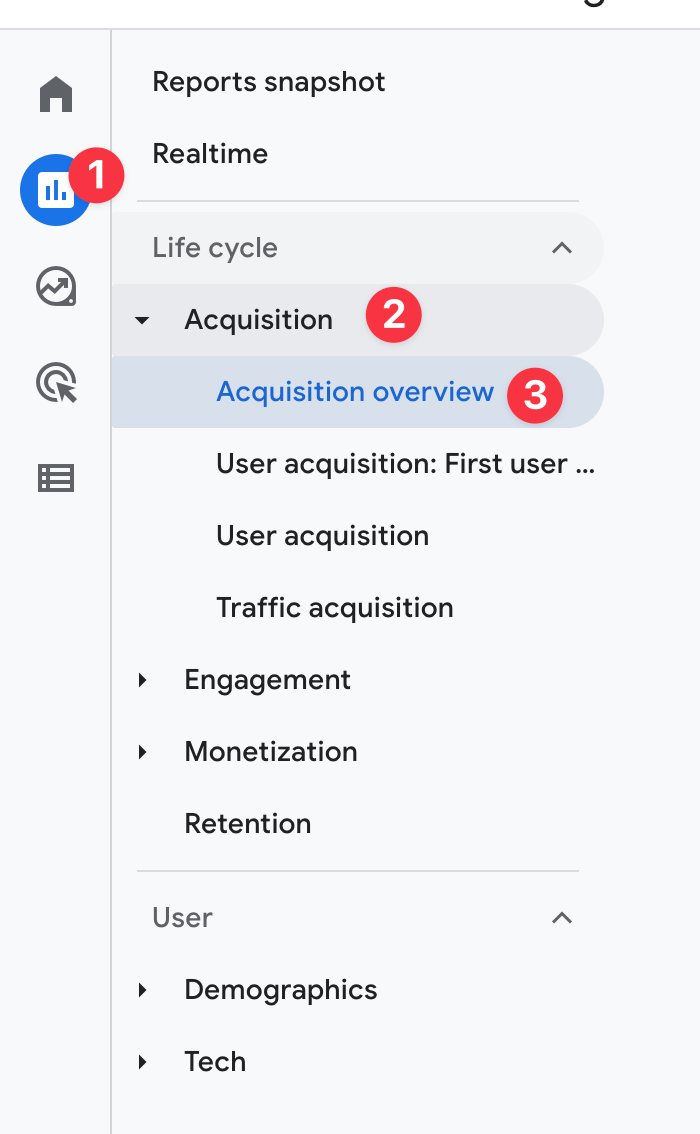
In the old Analytics version, Acquisition was one of the reports we used most often to measure SEO performance. It remains an important destination in GA4. To open it, follow Reports > Acquisition > Overview in the left menu.
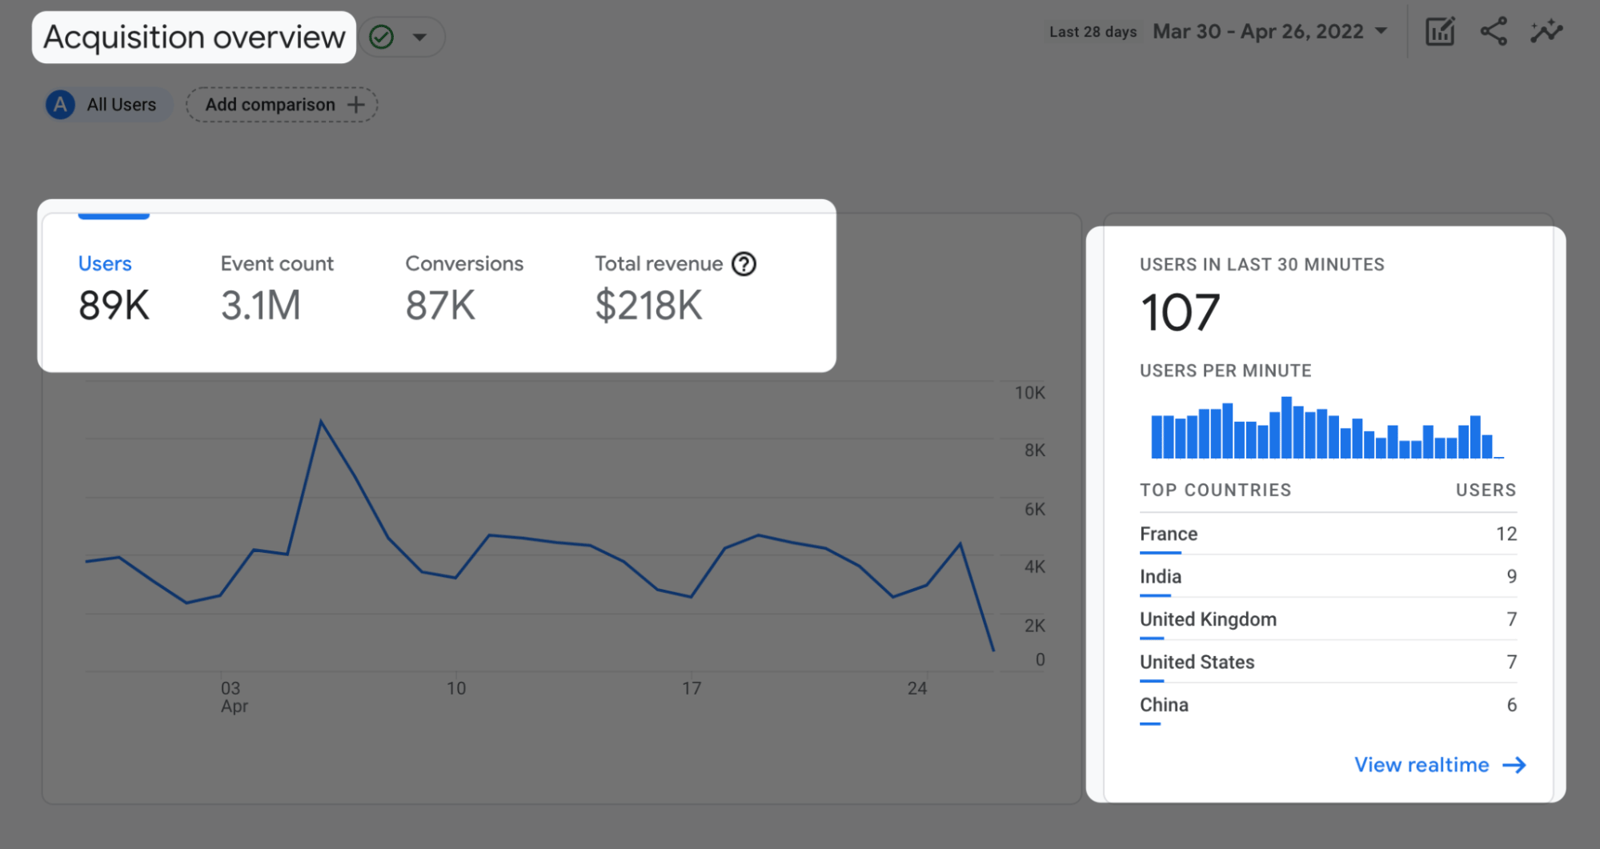
The Overview section provides a quick picture of acquisition and SEO performance. Alongside the metrics shown in the "Home" report, it includes Realtime data showing the number of users from the last 30 minutes.
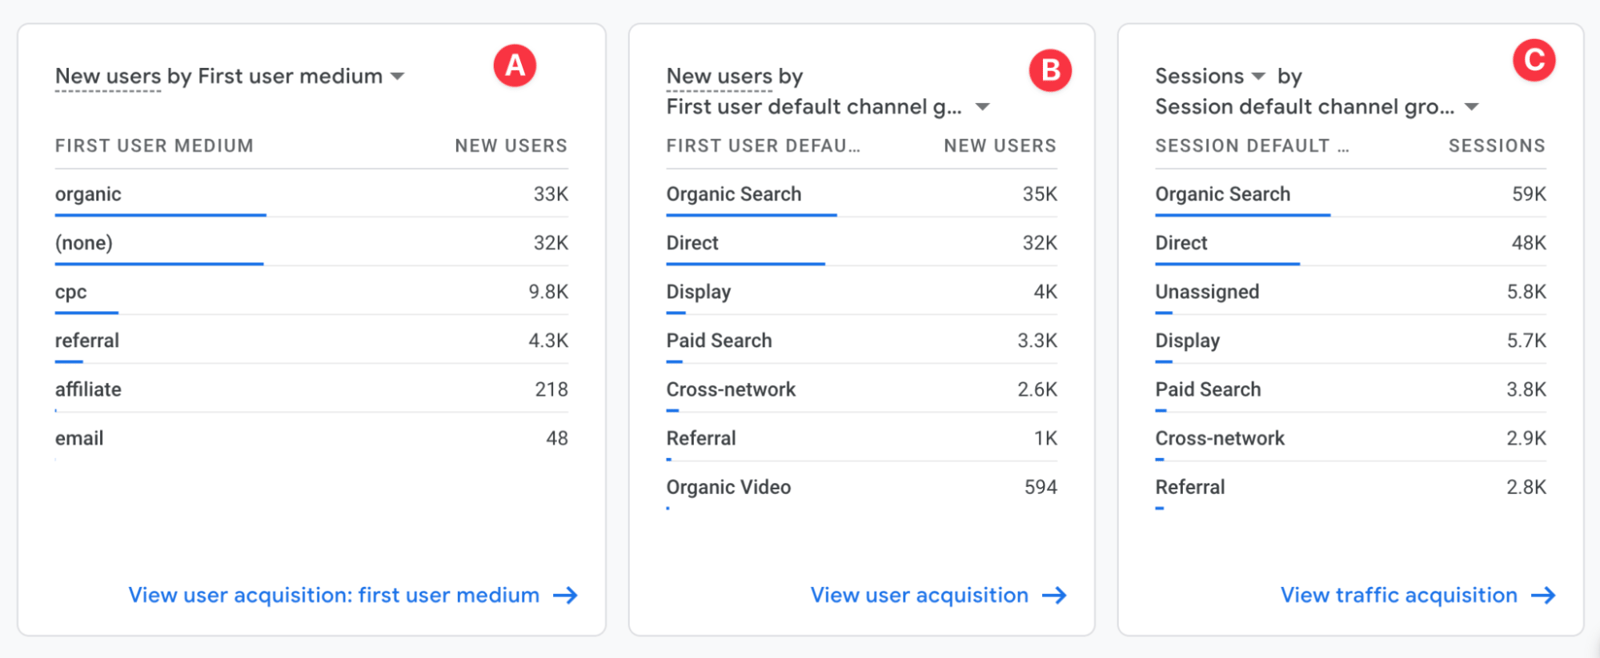
Scroll down to find more detailed cards. These cards provide a clearer view of SEO performance. I have numbered them and explained each one below.
- This card shows the "medium" data for users who came to the site for the first time during the selected period. Click "medium" to choose other dimensions related to the first user. The data is presented through the "new users" metric.
- The center card shows "default channel grouping" data based on the number of new users. Here, I can see that I gained 35K new users from the Organic Search channel in the last 28 days.
- The final card shows my "default channel grouping" data in terms of "Session". It tells me that I gained 59K organic sessions in the last 28 days.
Note: Click the icons below the cards to switch to the main report.
User Acquisition Report
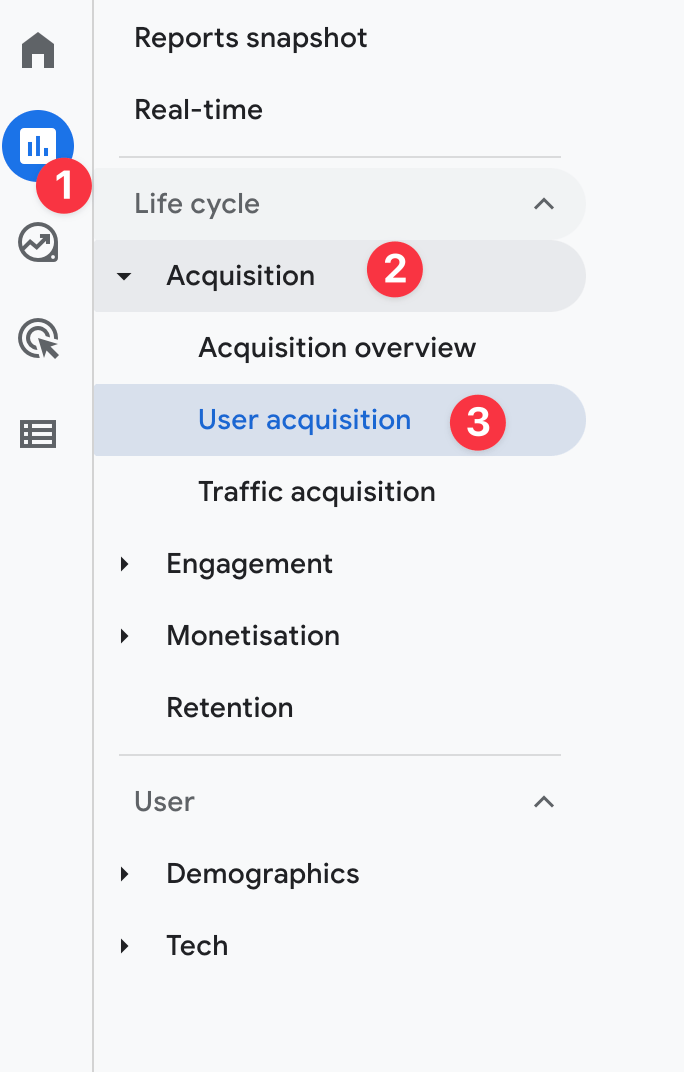
The User Acquisition report presents data about acquired users. Open it by following Reports > Acquisition > User Acquisition.
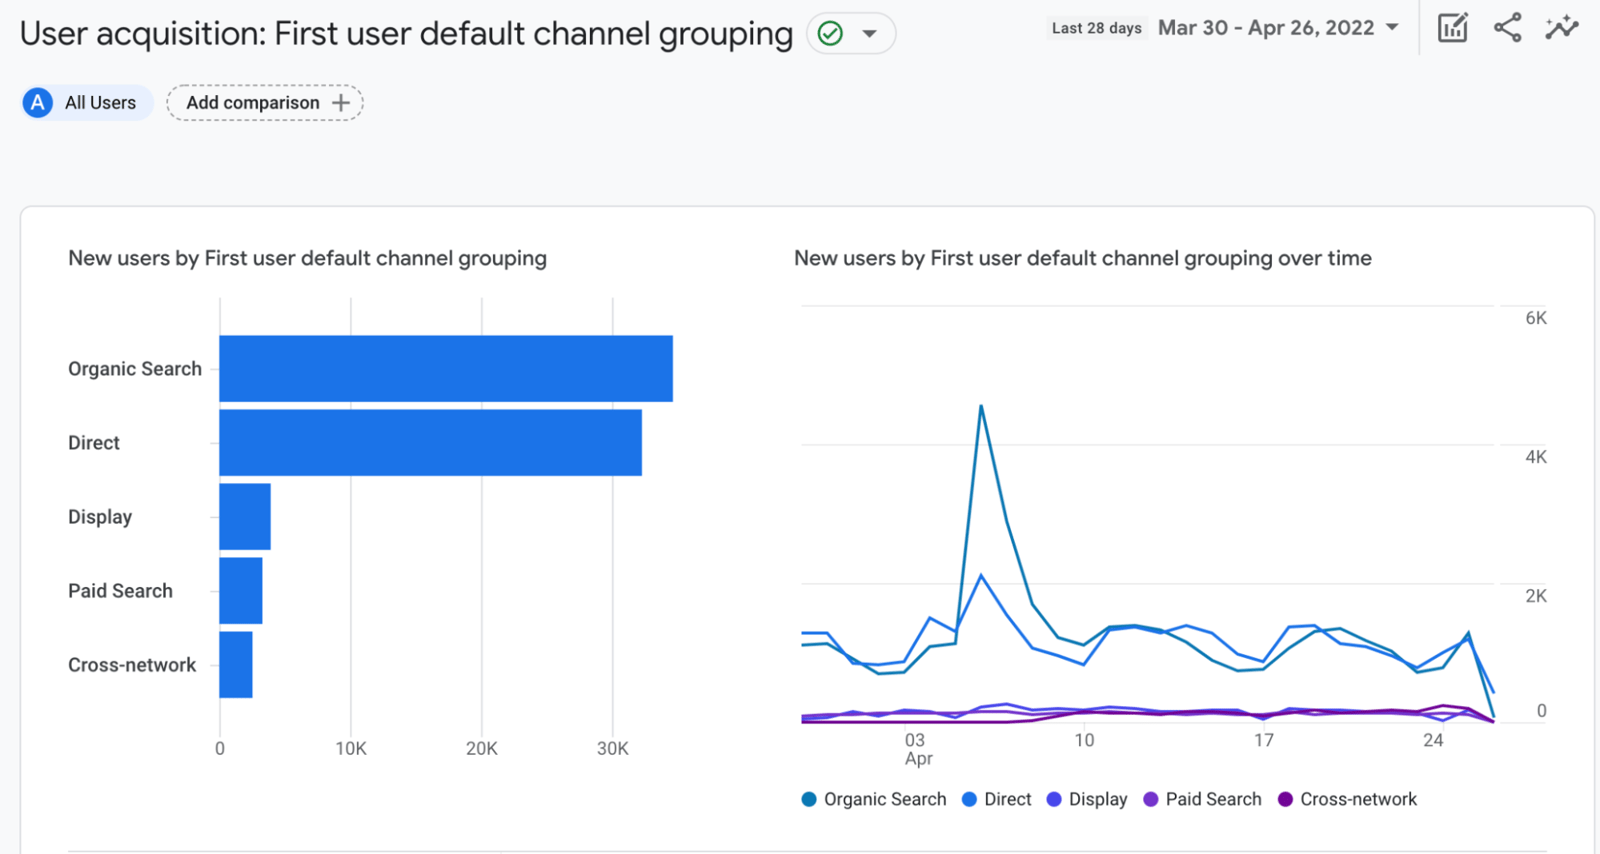
The report opens with the default channel grouping data for new users during the selected period. It presents this data in both column and line graphs, making it easy to compare the organic channel with other channels.
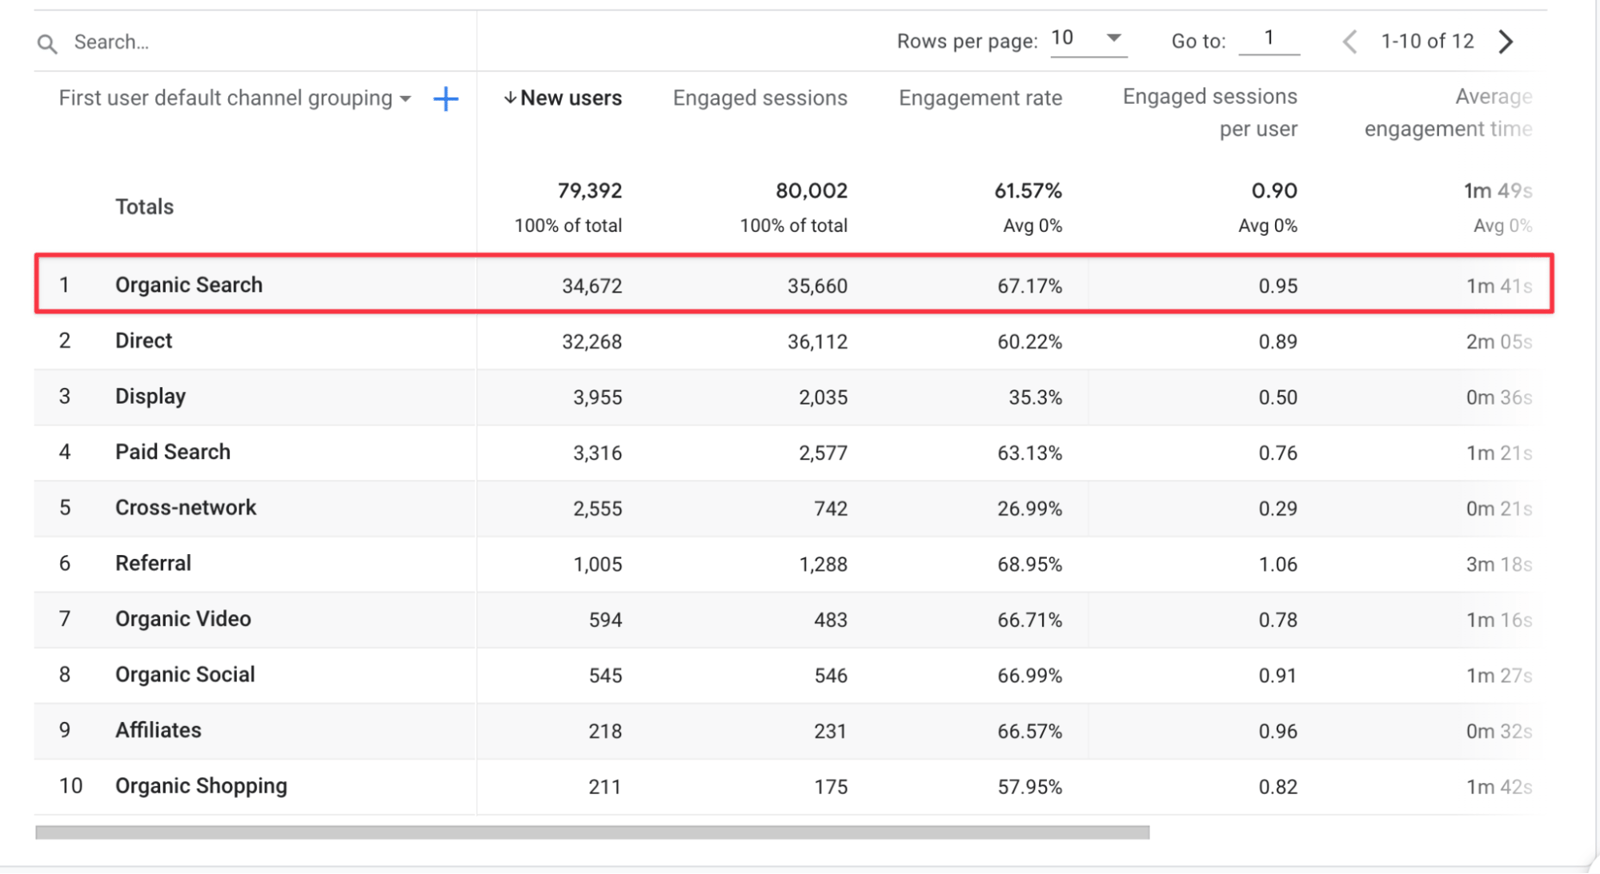
To examine organic user performance in more detail, scroll down to the channel and metric table. The marked area shows the metrics for organic new users. Use the horizontal scroll below the table to see additional metrics.
Traffic Acquisition Report
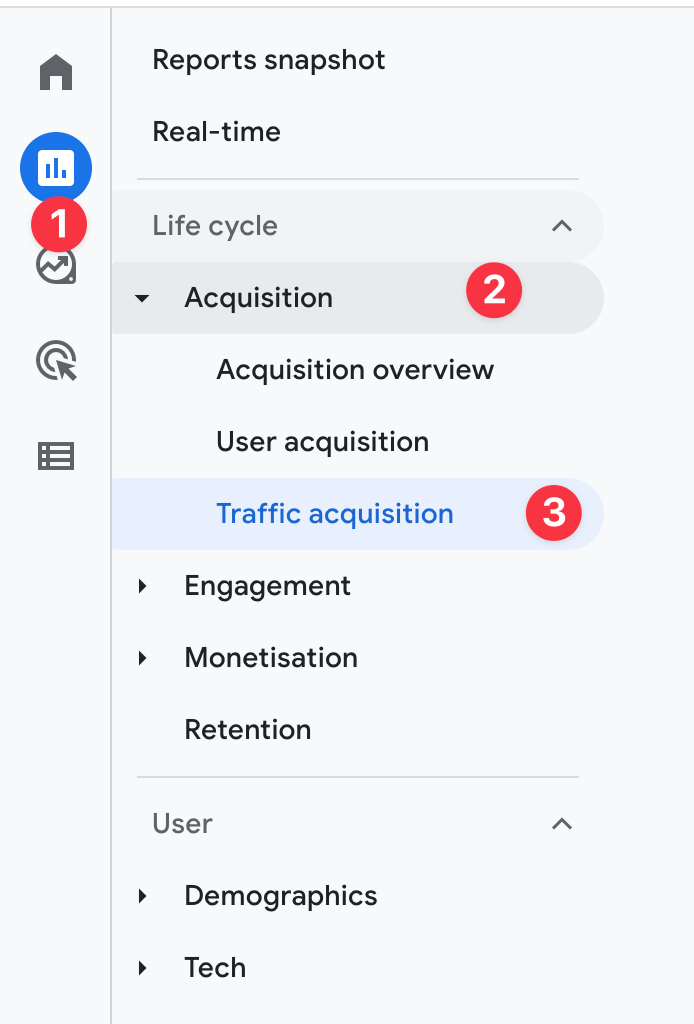
The Traffic Acquisition report focuses on session activity rather than user-specific data. It is likely to be one of the reports SEO experts use most often. Open it by following Reports > Acquisition > Traffic acquisition.
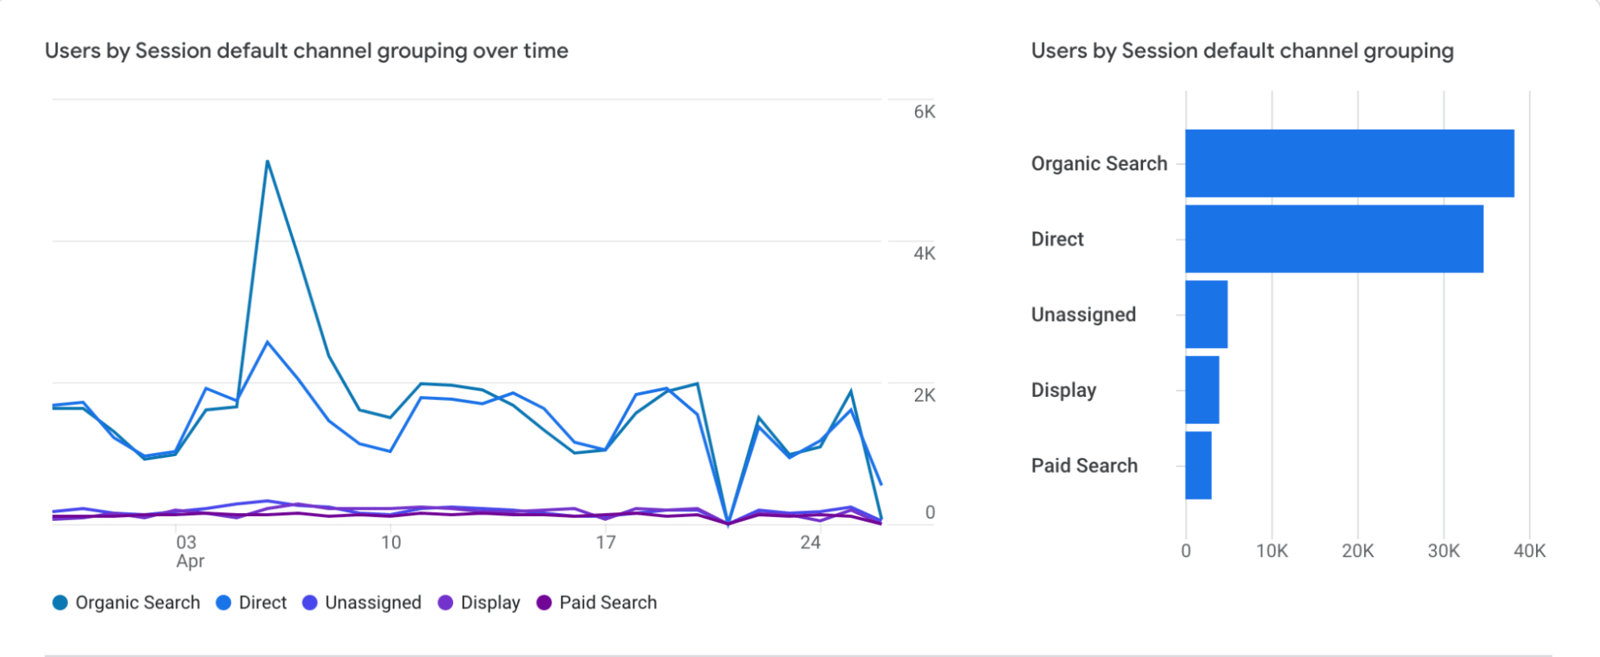
As in the User Acquisition report, the first elements we see are graphs. These graphs present data specifically for the "session" event.
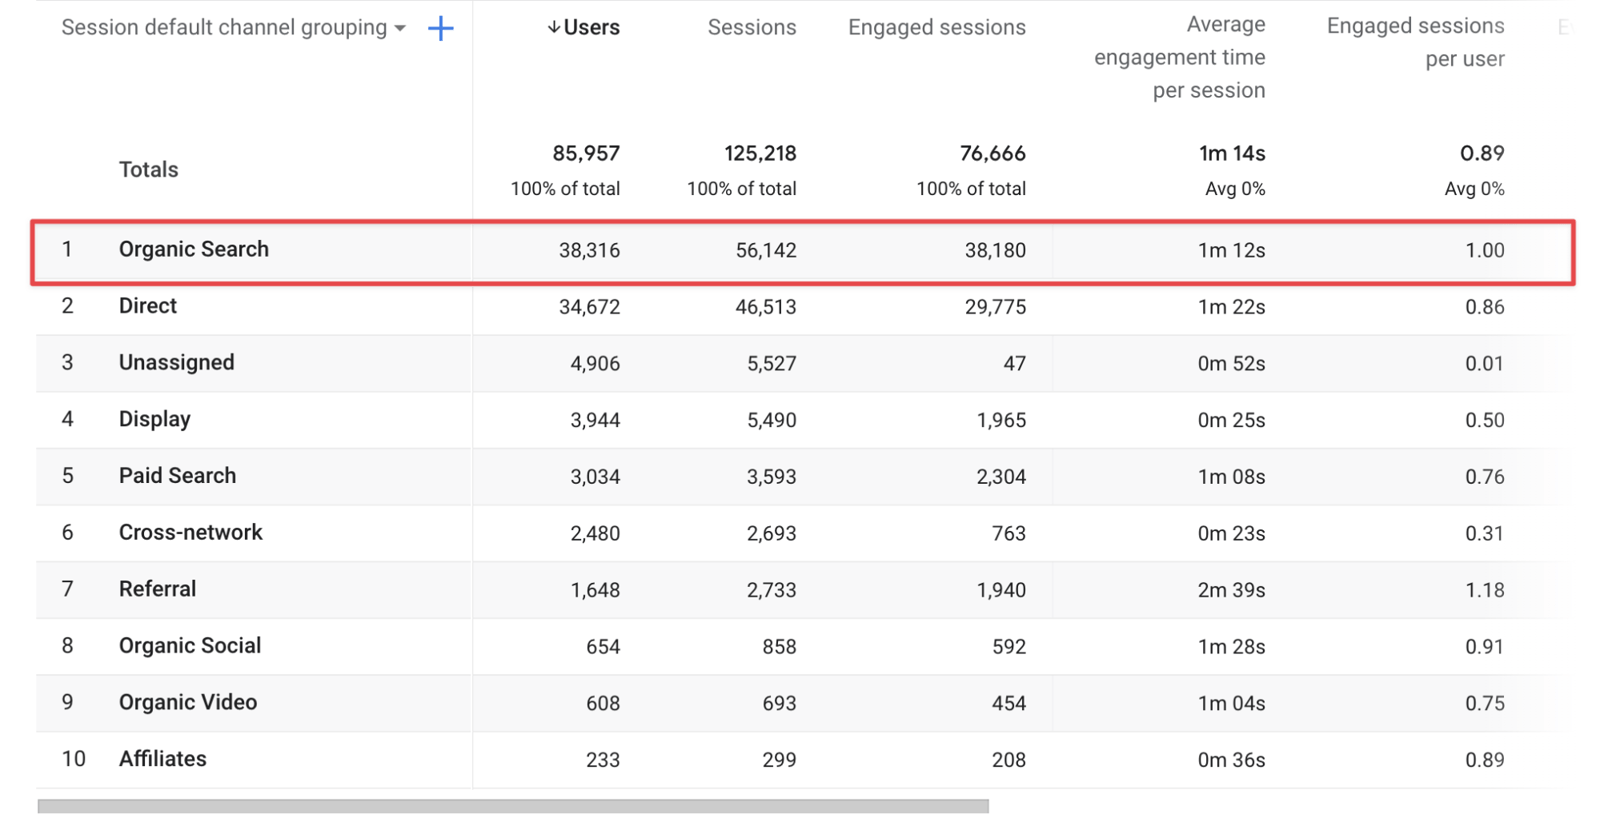
Farther down the screen, a table presents important metrics such as sessions and users by channel. As mentioned above, you can scroll horizontally from the bottom to see more metrics.
Engagement Reports
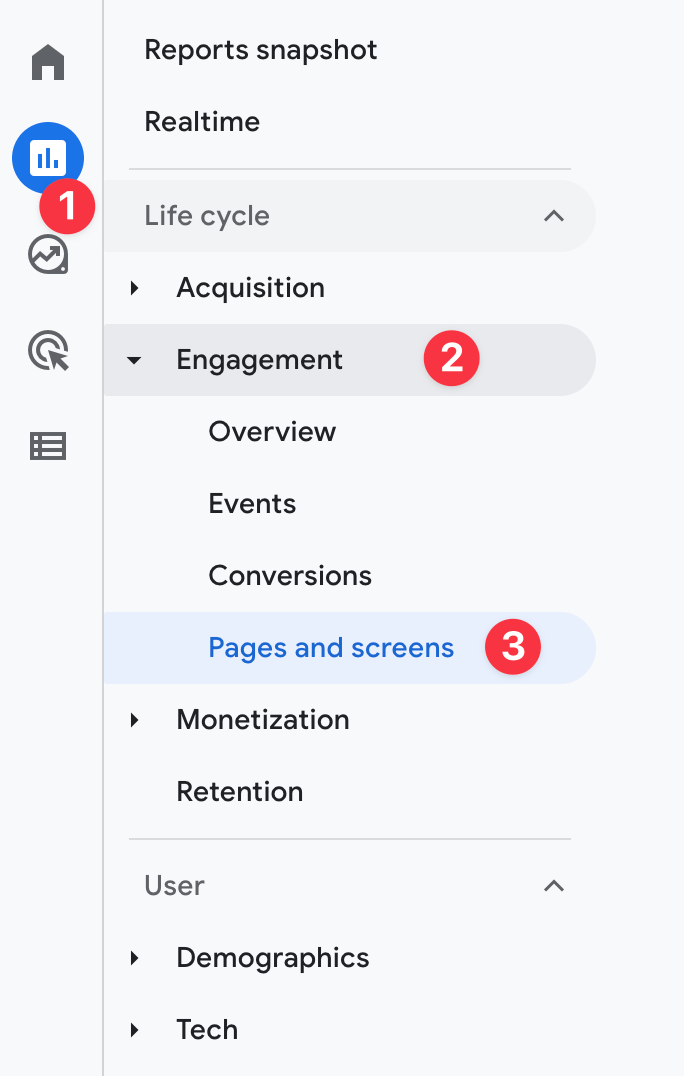
Engagement reports show the users and sessions that have interacted with your website. They include Overview, Events, Conversions, and Pages and screens reports. For SEO, we will mainly use the Pages and screens report. Open it by following Reports > Engagement > Pages and screens.
The Pages and screens report contains two chart types showing which pages on the site receive the most views.
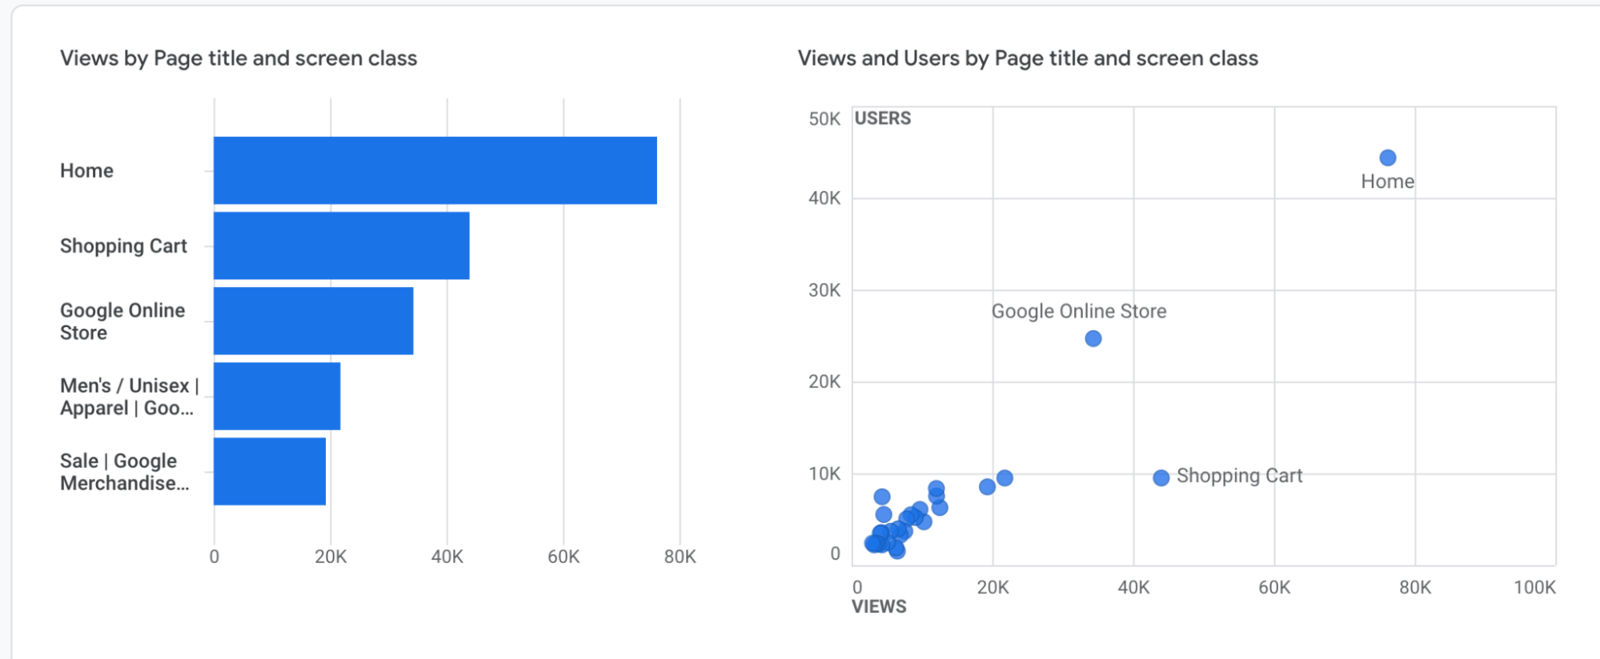
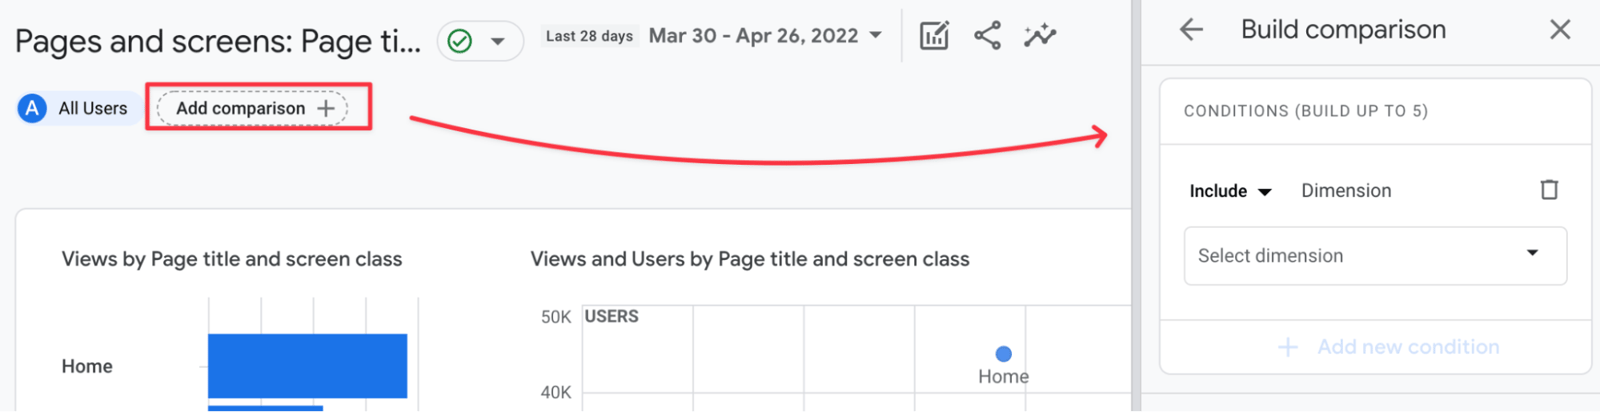
Because we are analyzing SEO performance, it makes sense to segment this data. I click Add comparison at the top of the report, which opens a window on the right.
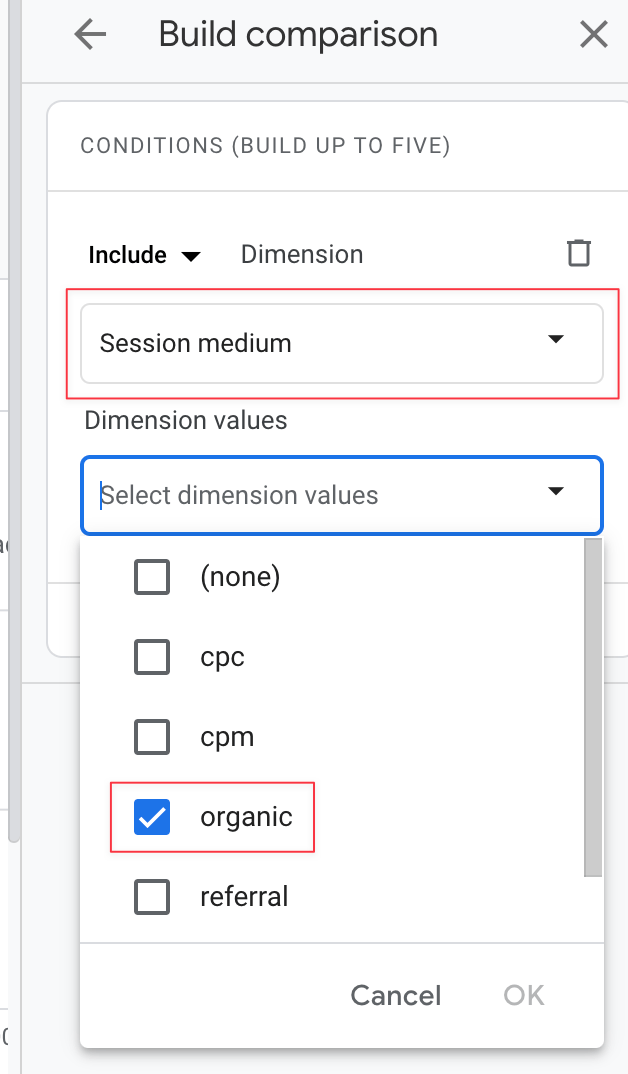
Next, I add Session medium to the Select dimension field and check the "organic" box in the Dimension values section.
After I remove the All Users section, the report looks like the screenshot below. This gives us segmentation similar to the old Google Analytics, and the report now includes only sessions with an organic medium.

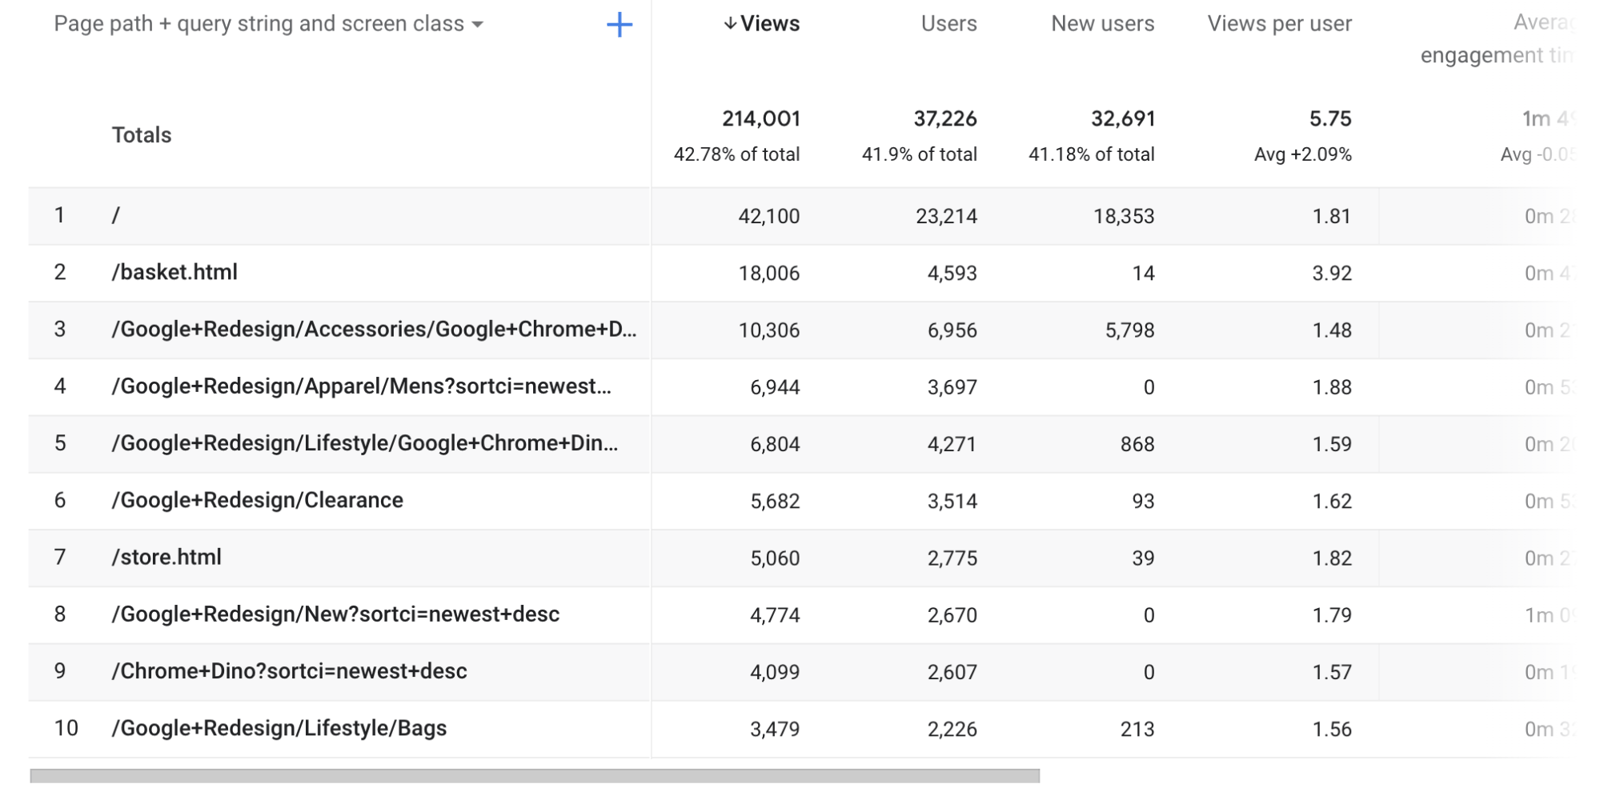
When I scroll down, I see the data in a table. To analyze it by page URL, I click the field marked in red below.
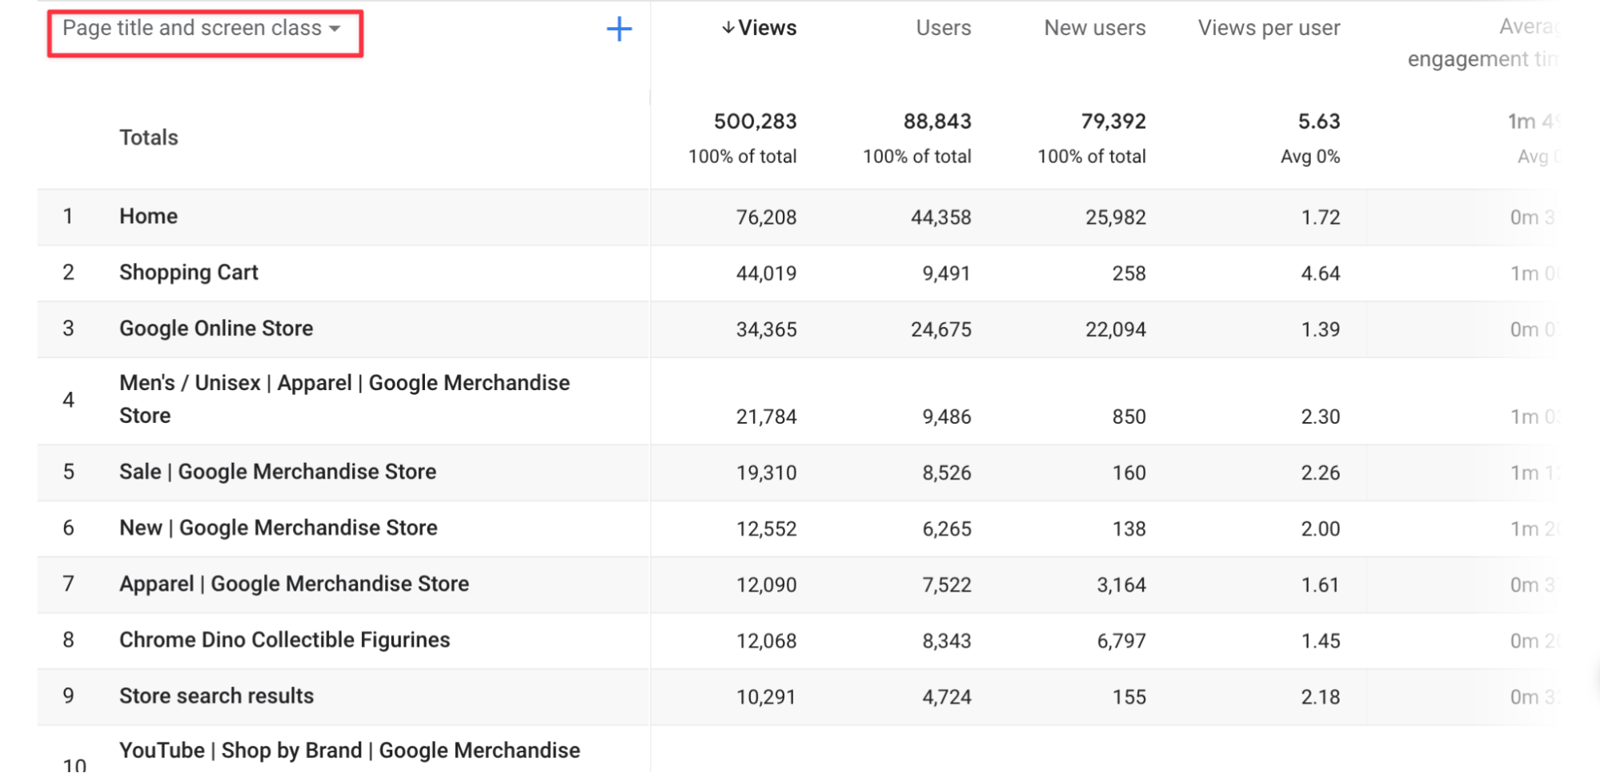
From the menu, I select Page path + query string and screen class. The report now displays page URLs, limited to the organic segment we created. We can use these metrics to analyze each page's organic performance.
Landing Pages
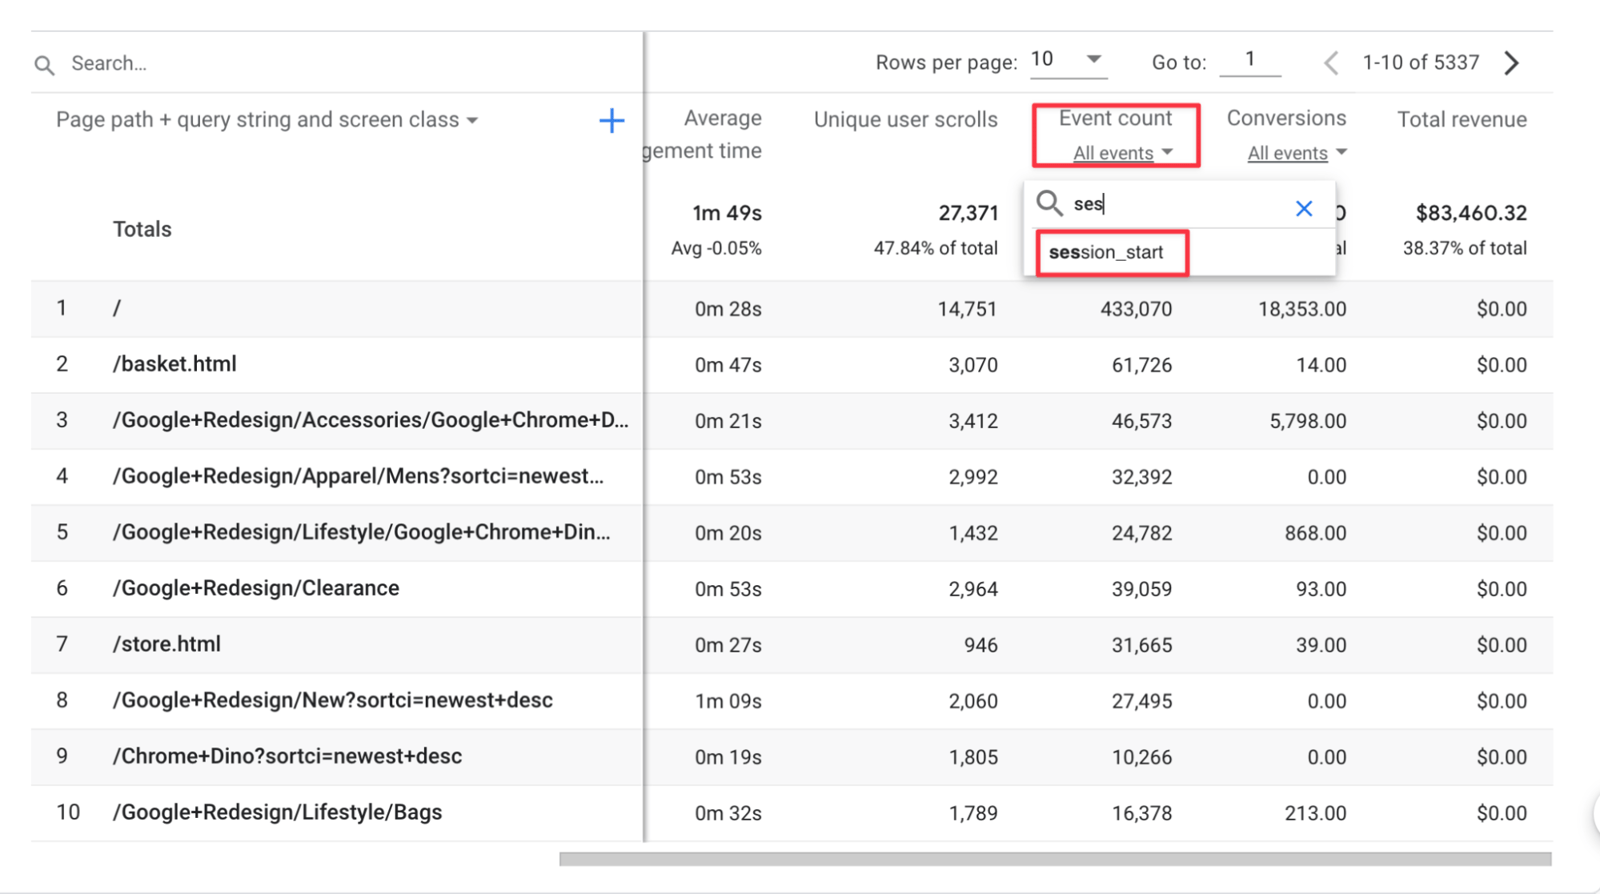
Seeing landing pages in GA4 requires a few adjustments to the report. In addition to the edits above, scroll to the right and find the "Event count" metric. Click it and select the session_start event, as shown below.
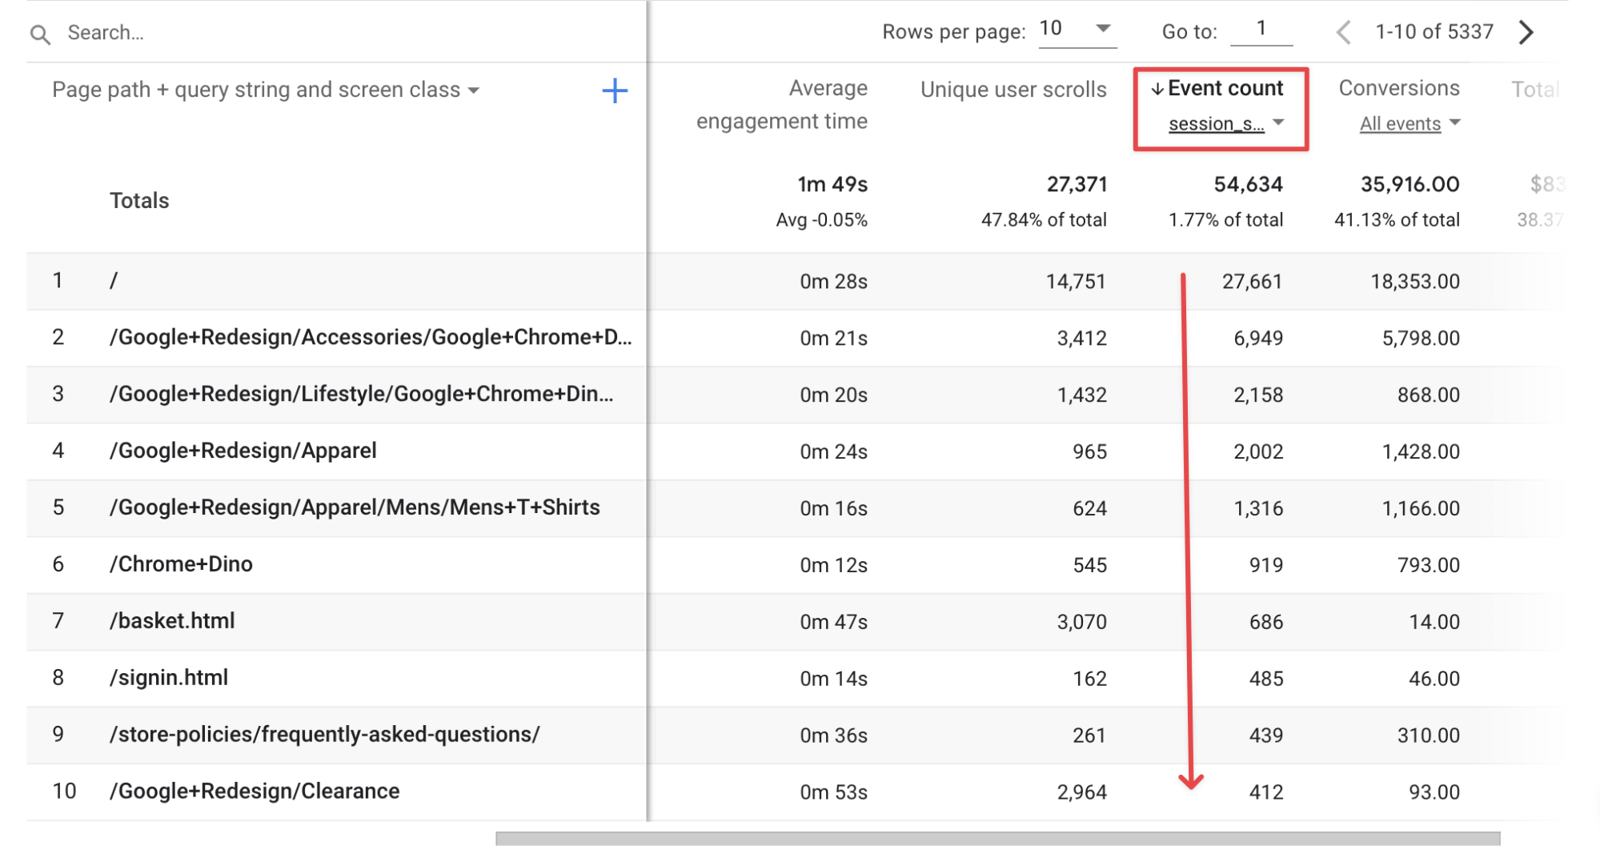
Once the session_start event appears, click the corresponding field once to sort it from largest to smallest. The resulting view sorts pages by where the session_start event occurred, meaning the pages where sessions began. These are the landing pages.
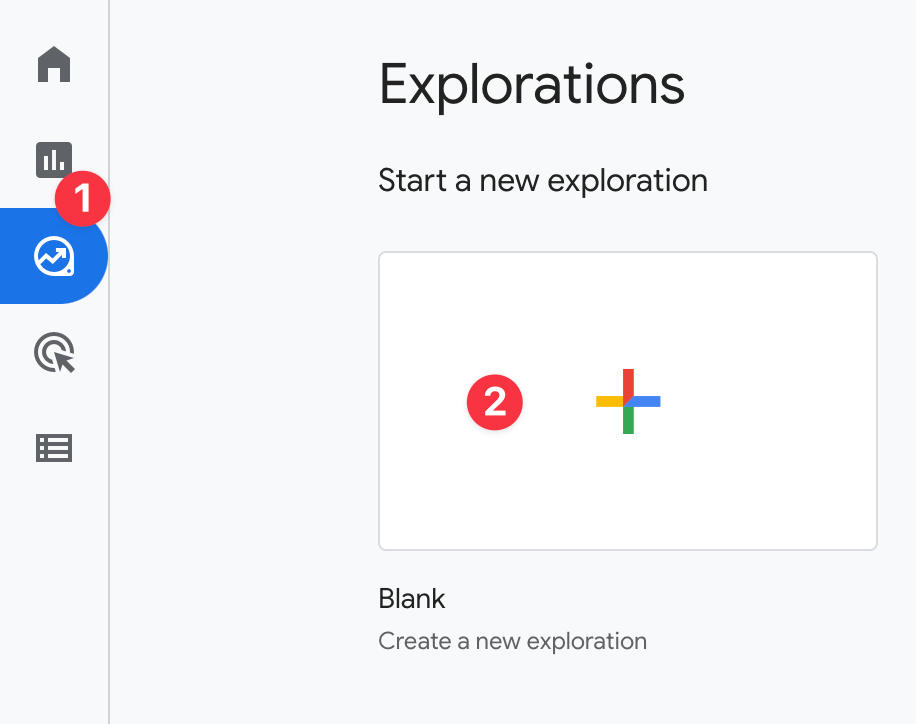
There is another way to view landing pages. Click Explore in the left menu, then click the box with the + sign to create a new report.
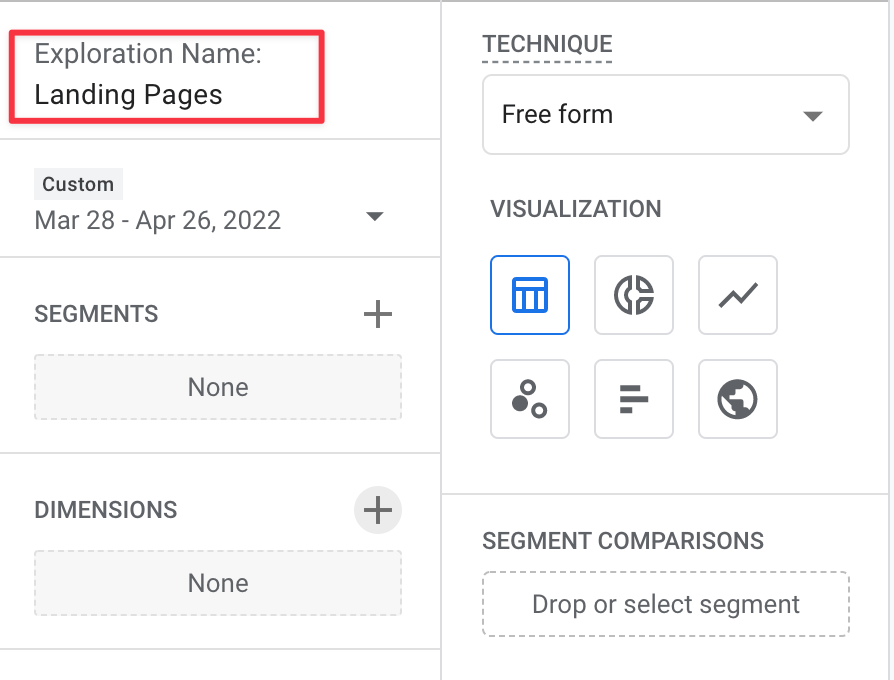
Give the report a name. I named mine Landing Pages, but you can choose a different name.
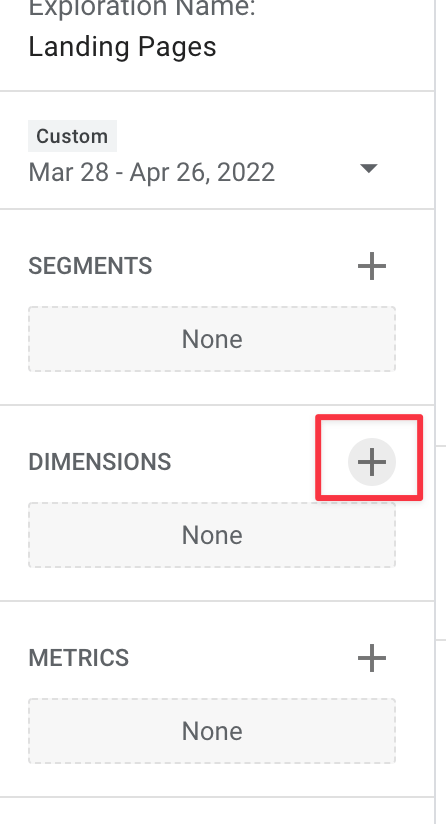
Click "+" in the Dimensions field.
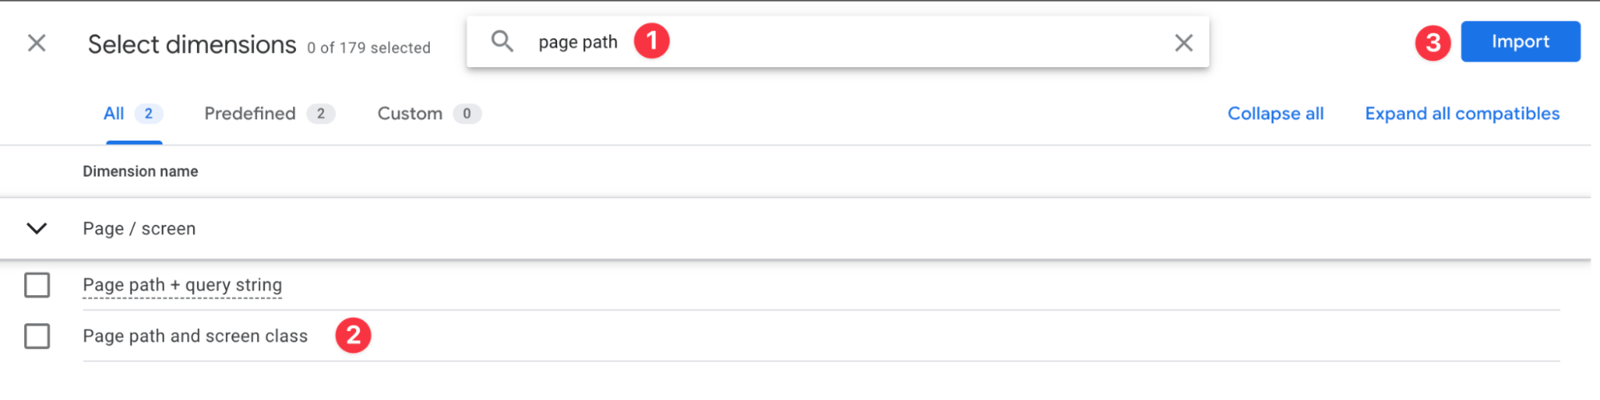
In the window that opens, type "page path" into the search bar. Select the "Page path and screen class" box from the results, then click "Import".
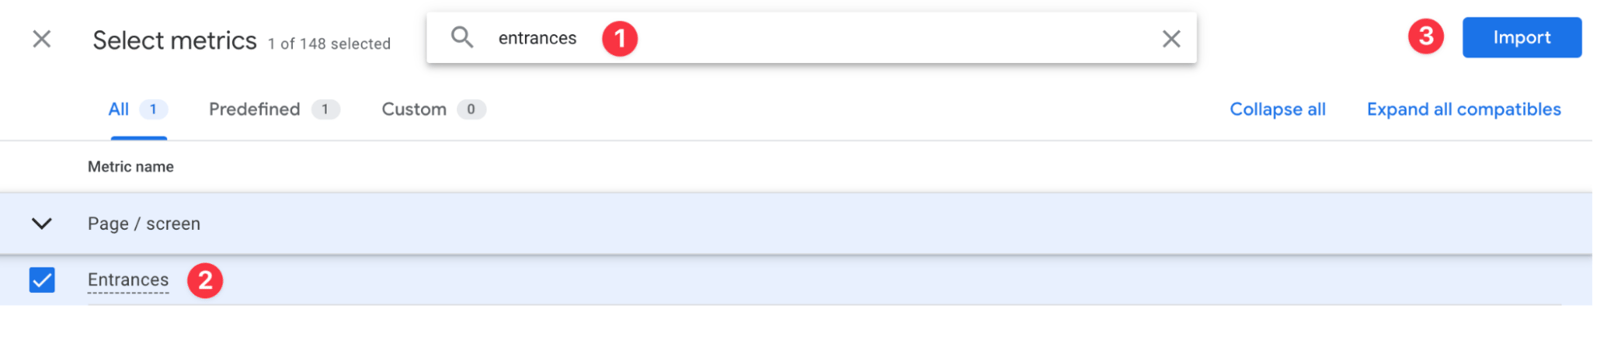
Now that we have selected the dimension, we can add metrics. As above, click "+" in the "Metrics" section below Dimensions. Type "Entrances" into the search bar, select the metric and click "Import". You can add more than one metric, so I also add "Engagement rate", and "Views" metrics using the same method.
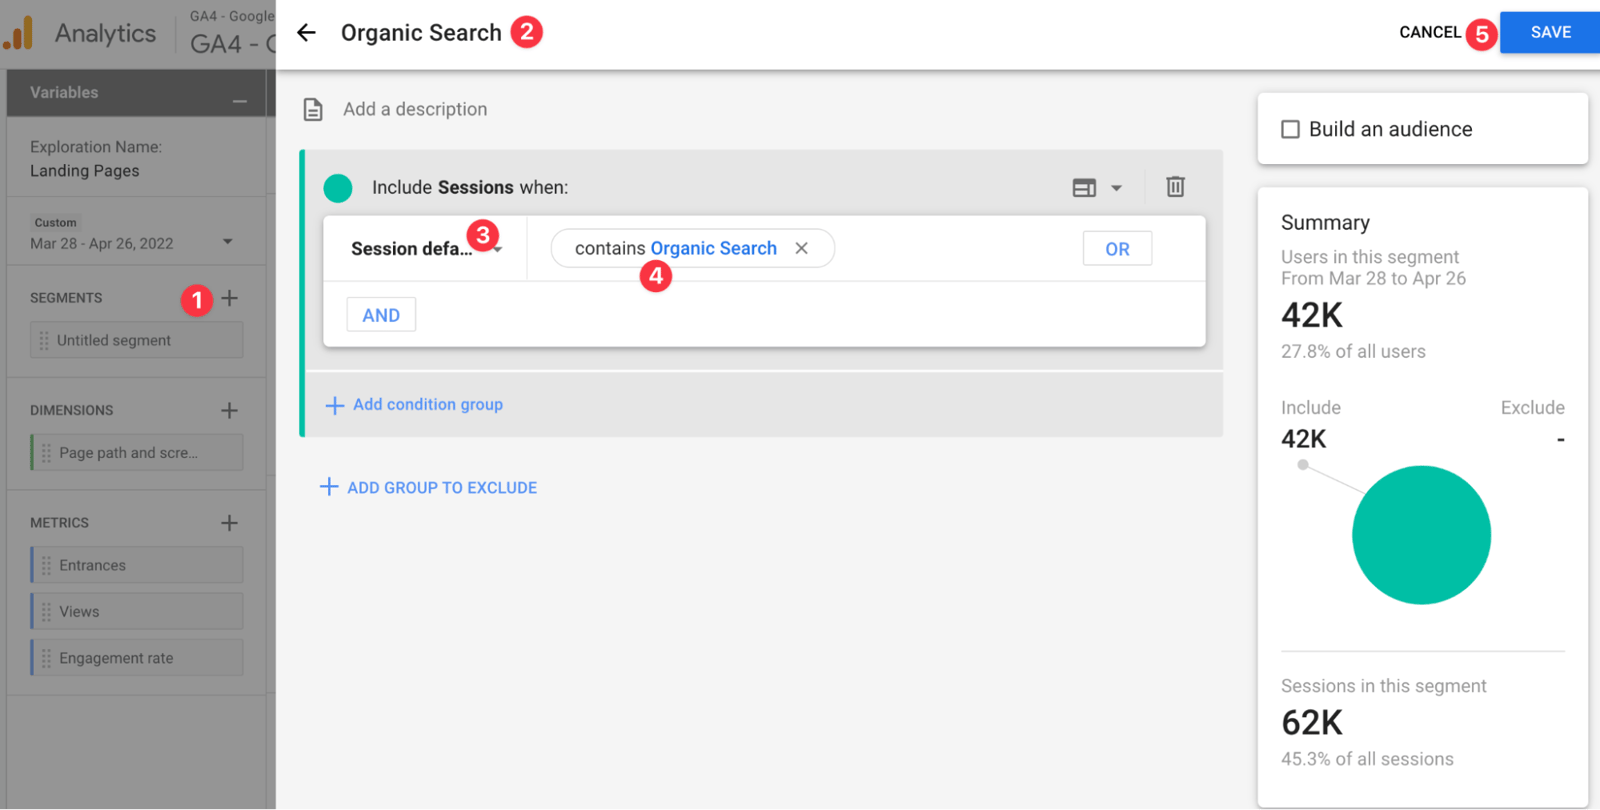
Because we are measuring SEO performance, we can add an organic session filter. I follow these steps:
- I click on the "+" icon in the Segments field,
- Nomenclature,
- I am selecting session default channel grouping,
- I'm selecting the Organic Search channel,
- Save
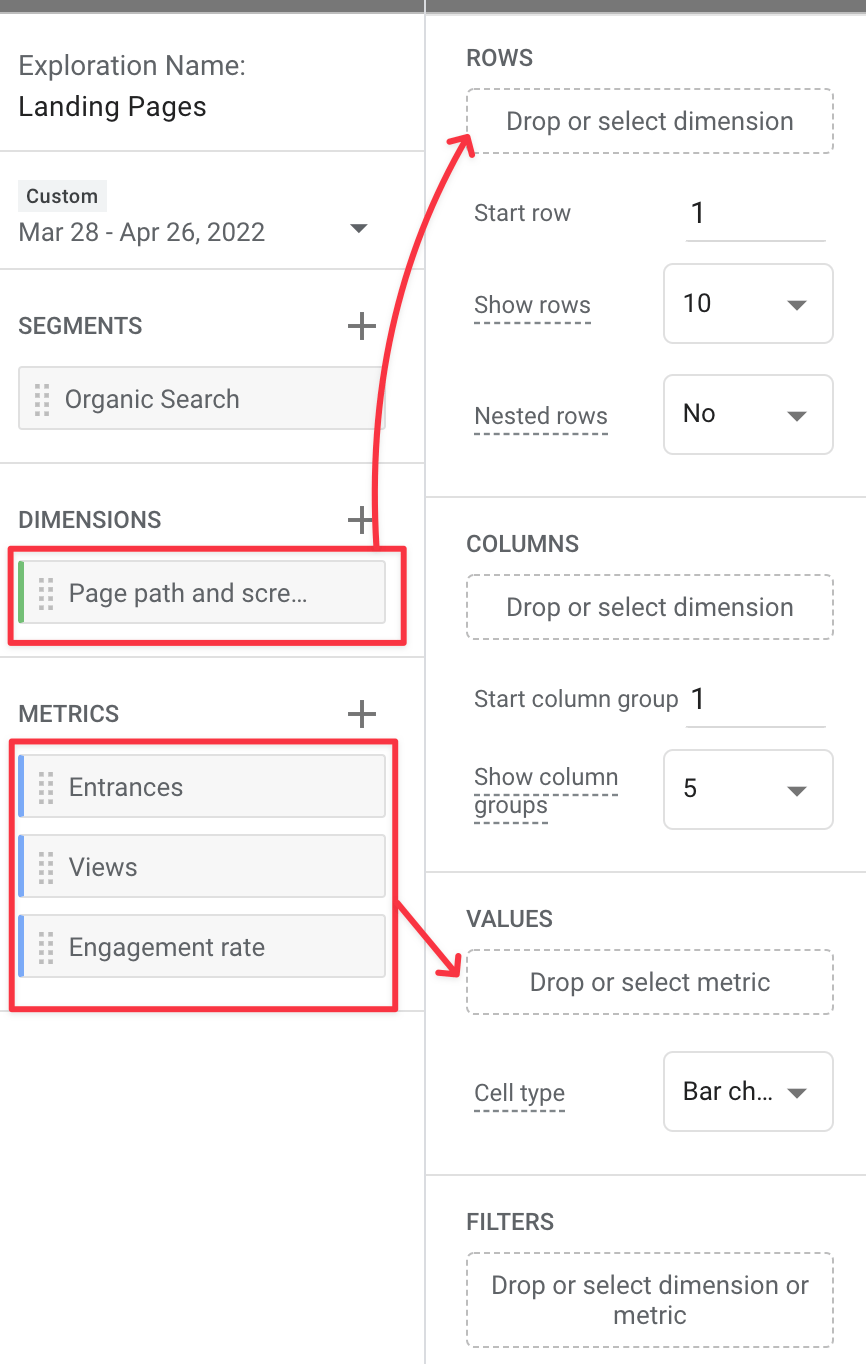
Finally, I drag and drop dimensions into Rows and metrics into Values.
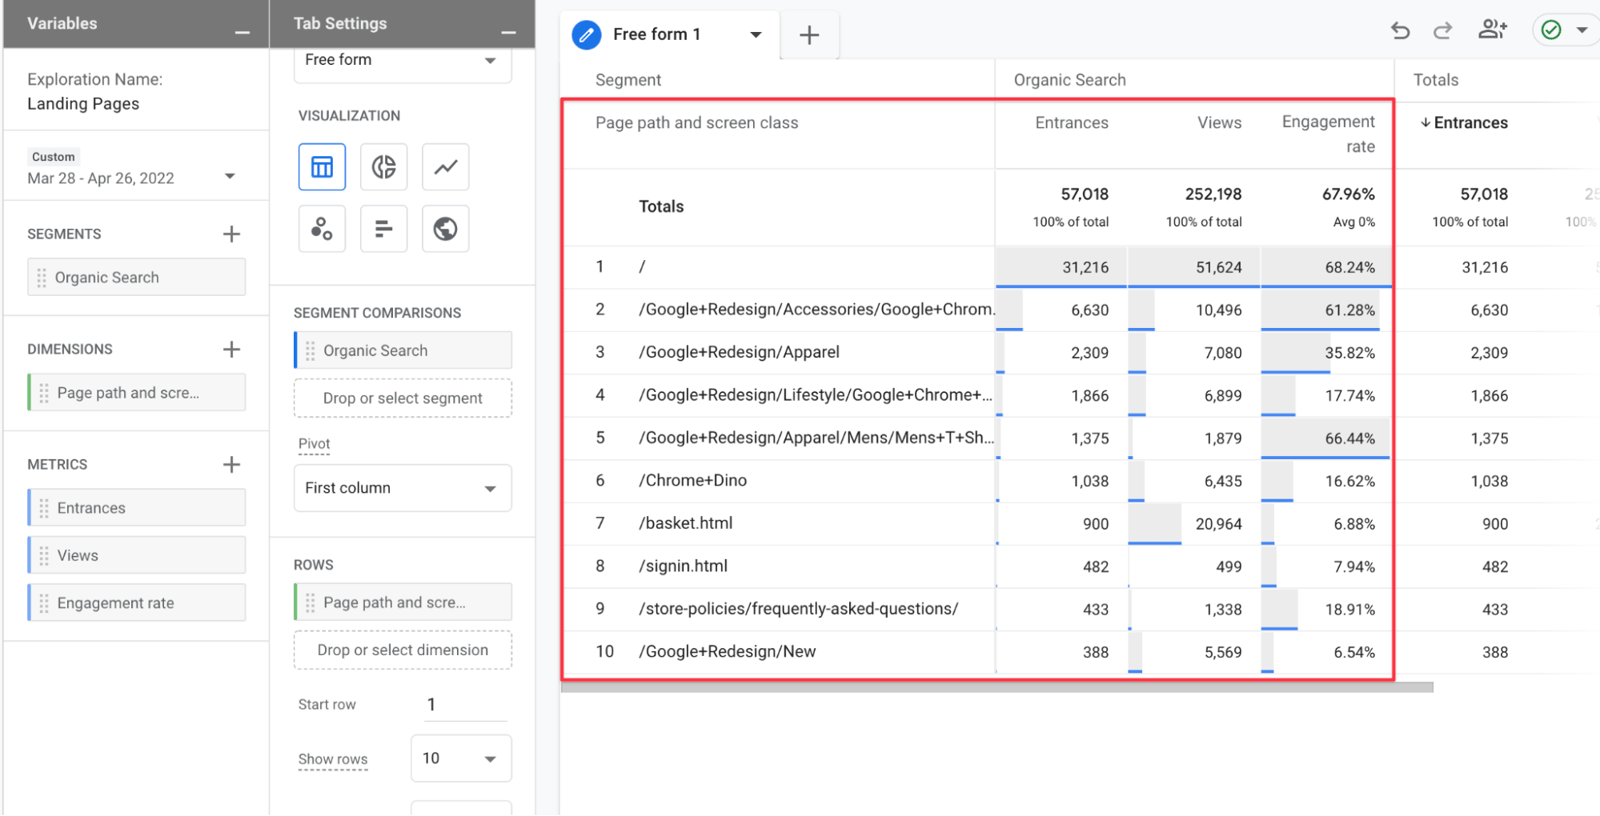
The landing page report is now ready. You can remove the Organic Search segment or analyze landing pages with different metrics. The metrics you use in addition to entrances depend entirely on your measurement priorities.
Important Metrics in SEO Performance Measurement
So far, we have focused mainly on report screens. The following metrics can also help you analyze SEO performance. The most useful metrics will vary by sector and site structure, but these are worth considering:
- Engaged Sessions: Sessions lasting at least 10 seconds, containing at least 1 conversion or multiple page visits.
- Engaged sessions per user: The average number of engaged sessions per user.
- Engagement rate: The percentage of engaged sessions compared to all sessions.
- Entrances**:** The number of times the first activity recorded for a session occurs on a page or screen.
- **Exits:** The number of times the last activity recorded for a session occurs on a page or screen.
- Views: The number of mobile app screens or web pages your users see. Duplicate impressions of a single screen or page are also counted.
- Returning users: The number of users who have started at least one previous session.
- Total users: The total number of unique users who triggered at least one event.
- Views per user: The average number of web pages viewed per user.
Final Words
The measurements that matter for SEO will vary according to your site's content, industry and customer priorities. Web analytics and measurement is a bottomless pit.
In this article, I wanted to show a straightforward way to analyze organic performance in GA4. I hope you found it useful. See you in the next web analytics Zeo blog content…
Useful Resources:
https://support.google.com/analytics/answer/9143382?hl=en&ref_topic=11151952
https://support.google.com/analytics/topic/9303476?hl=en&ref\_topic=9228654


