


GTmetrix is an important tool for measuring site speed and checking compliance with Core Web Vitals metrics, and it offers plenty of modules that make building reports easier. Some features work fine on a Free account, but upgrading to Premium unlocks a lot more.
Let's walk through the features that give you insight into page load times, page performance, problems affecting page speed, and more, starting from GTmetrix's initial setup.
Initial Settings
When you log into GTmetrix, you can make a few adjustments on the Dashboard screen before testing your site speed.
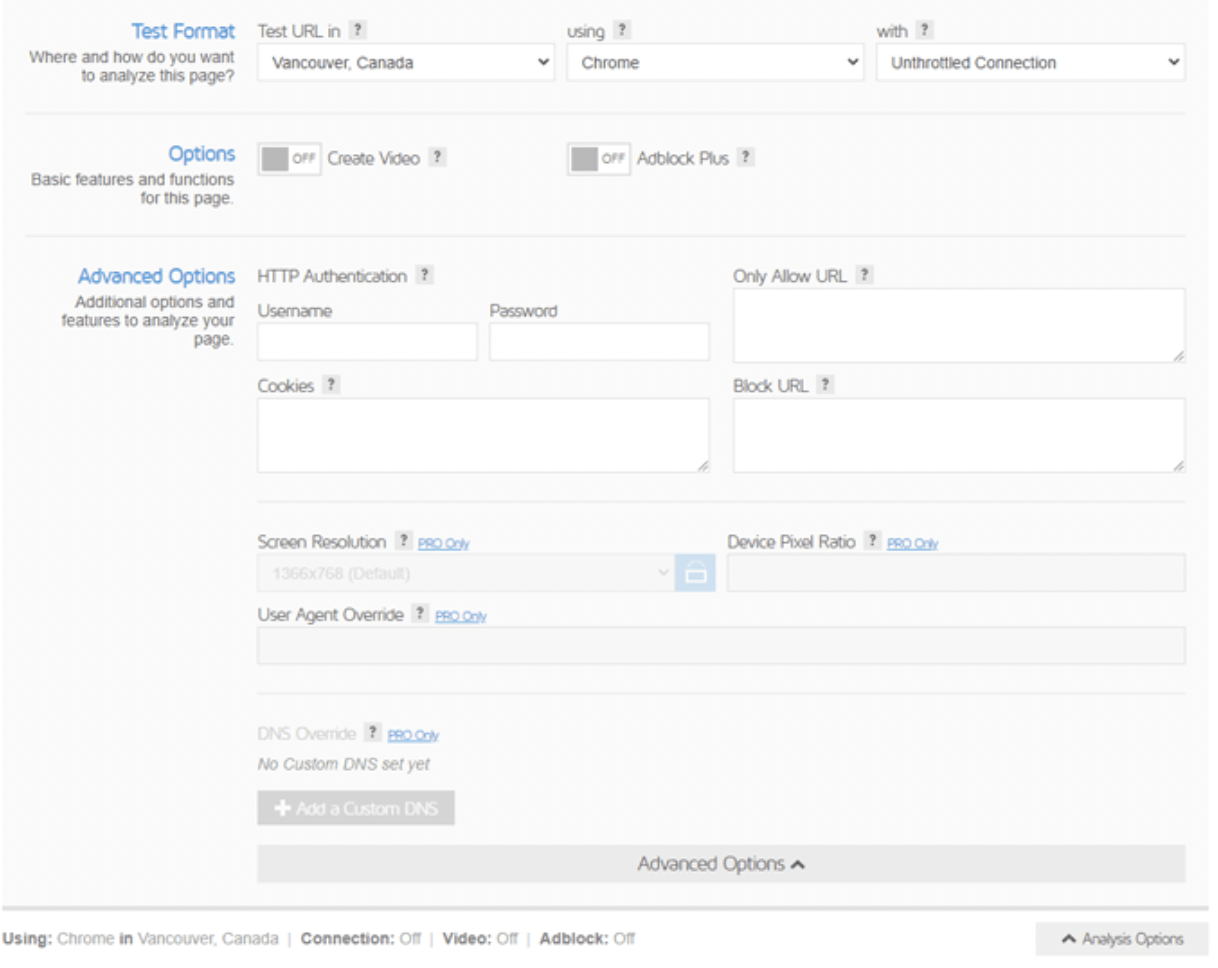
These options can have a real impact on page speed, so they can meaningfully shape the report you end up with. Let's look at the settings you'll run into here.
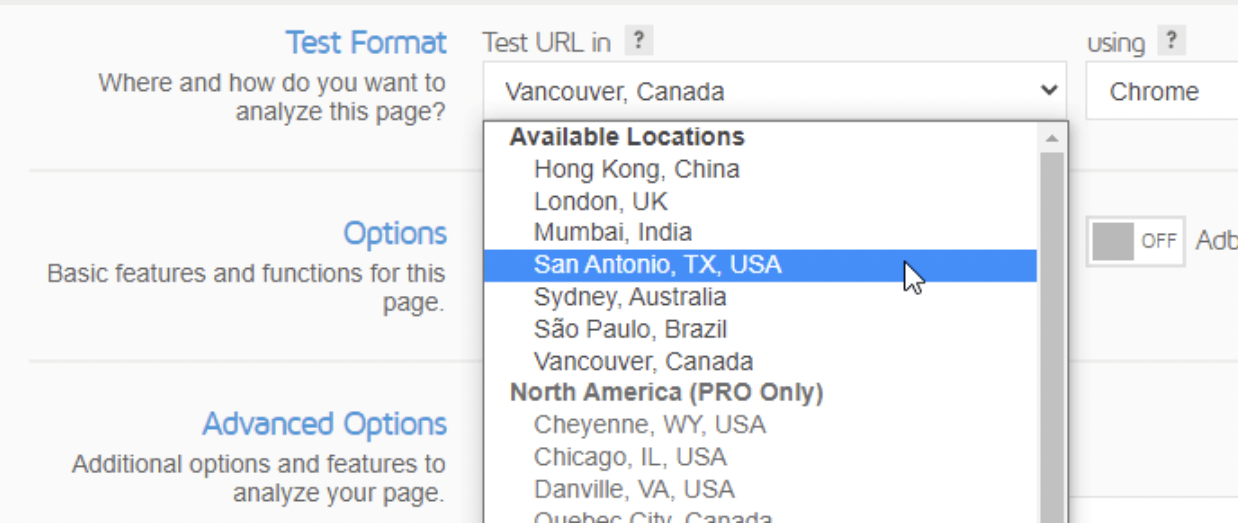
Under Test Format, you can pick the server location you want to test your site from. The geographic distance between your server and a visitor affects network latency a lot, the farther apart they are, the longer the data has to travel, so it matters to choose the location correctly.
With a Free membership, you can pick from 7 different global regions. Premium lets you select specific cities directly, like Frankfurt, Paris, and Stockholm. When choosing here, pick the region where your users are mostly located, you can use your Google Analytics data for this.

Under Using, a Free account only gives you the desktop option with Chrome, while Premium opens up more than 30 device options along with mobile testing.
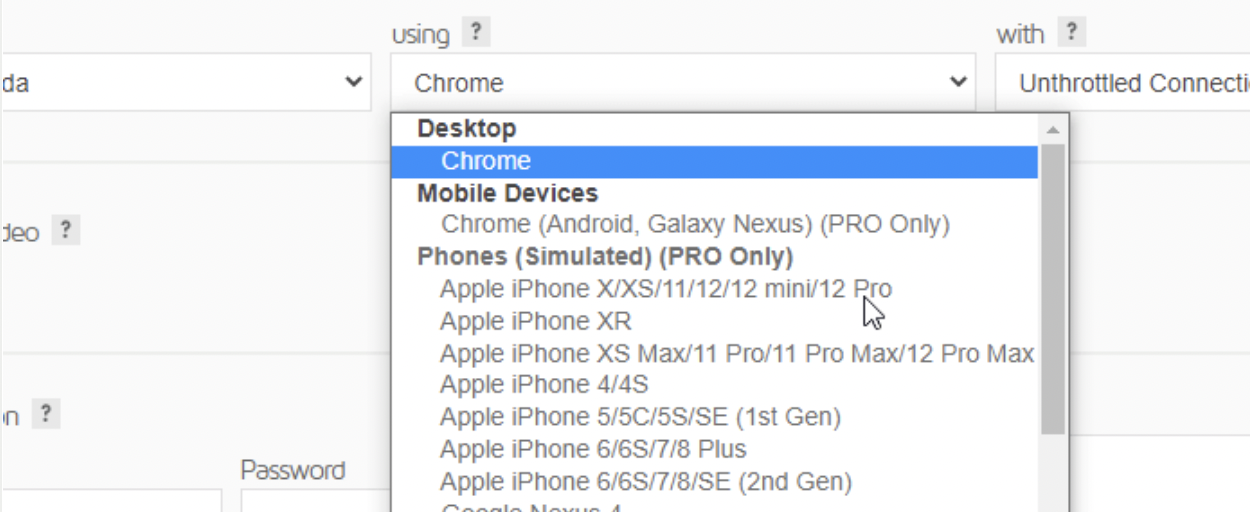
It matters to distinguish between mobile and desktop, since pages can load quite differently across device types, so it's worth understanding your visitor profile and checking performance across the board, then improving accordingly. It's worth figuring out which device type your users prefer most and analyzing that specifically, you can use your Analytics or Google Search Console account to check which device your users rely on most.
Under With, the last setting in this section, you can choose your connection speed.
You can pick from 8 different connection speeds, including options like 3G and LTE. Here too, it matters to choose the connection speed that matches your users and measure accordingly.
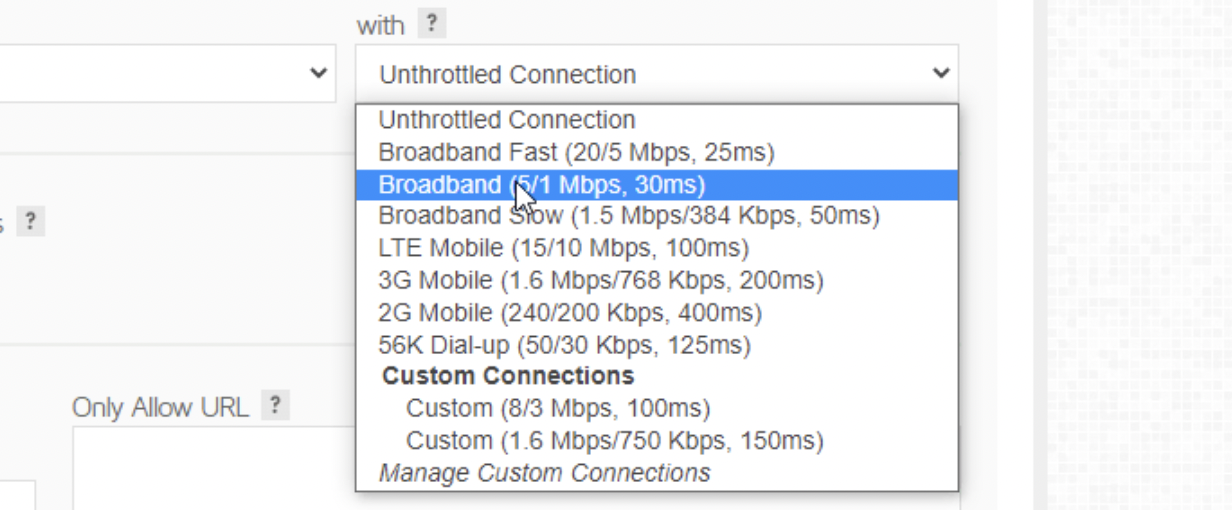
If you're a Premium user, you can run measurements using custom download and upload values that better represent your visitors, through the Custom Connection Speed feature.
Under Monitor and Set Up Alerts, performance tracking matters because it lets you step in instantly when problems develop on your site. In the free version, you're only allowed to monitor 1 page this way.
GTmetrix Analytics
Once you've made the necessary adjustments and dig into the analysis, you'll find GTmetrix bases its scoring on the Lighthouse system Google publishes to improve web quality. GTmetrix layers its own measurement data on top of Lighthouse's.
GTmetrix scoring evaluates a page's performance across load, user interaction, and visual stability to produce a result. This scoring gives a solid representation of the overall web experience, since it accounts for both frontend structure and actual performance.
That said, GTmetrix calculates 2 types of scores: Performance Scores and Structure Scores. The Performance Score is your Lighthouse score from GTmetrix's tests, showing how well your page is structured from a user's perspective.
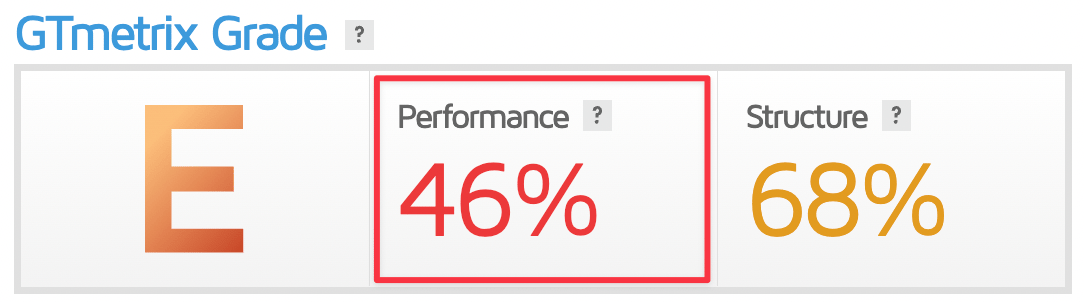
Performance Score
The Performance Score metric weighs 3 core areas: Loading Performance, Interactivity, and Visual Stability. Loading Performance carries a 45% weight in the Total Performance Score, and the Core Web Vitals metrics First Contentful Paint and Largest Contentful Paint matter a lot here.
The Interactivity score is shaped by engagement and blocking time, and carries 40% of the Total Performance Score.
Visual stability ties directly to the Cumulative Layout Shift metric, familiar from Web Vitals, and carries a 15% weight in the Performance Score.
In short, the structure breaks down like this.
Loading performance (45%)
- First Contentful Paint (10%)
- Speed Index (10%)
- Largest Contentful Paint (25%)
Interactivity (40%)
- Time to Interactive (10%)
- Total Blocking Time (30%
Visual Stability (15%)
- Cumulative Layout Shift (15%)
Let's briefly detail what each of these metrics actually measures.
First Contentful Paint: the time it takes for the first painted element on the page to load. A maximum of 1.8 seconds is recommended.
Speed Index: measures how fast the page's content can load, essentially how quickly it becomes visible. A maximum of 3 seconds is recommended.
Largest Contentful Paint: the time it takes for the largest paintable element on the page to load, usually an image. The recommended maximum here is 2.5 seconds.
Time to Interactive: the time it takes for the page to become fully interactive, meaning every sub-resource has loaded and the entire page is ready. A maximum of 3.8 seconds is recommended.
Total Blocking Time: measures the loading time of each task between First Contentful Paint and Time to Interactive. Specifically, it measures the blocking time created by tasks that take longer than 50 ms to load during page creation, tallying up how much those tasks exceed the 50 ms threshold. That total becomes the Total Blocking Time.
Cumulative Layout Shift: measures the page's visual stability, calculating how much images, fonts, and buttons shift during loading and once the page is fully loaded. Values below 0.1 are considered good.
Calculating all these metrics together produces the final Performance Score. You can dig into the details of your performance score under the Performance tab, and alongside your score, the Browser Timing section below shows which parts of your page take longer to respond. Worth noting: the data in Browser Timing doesn't directly affect your Performance score.
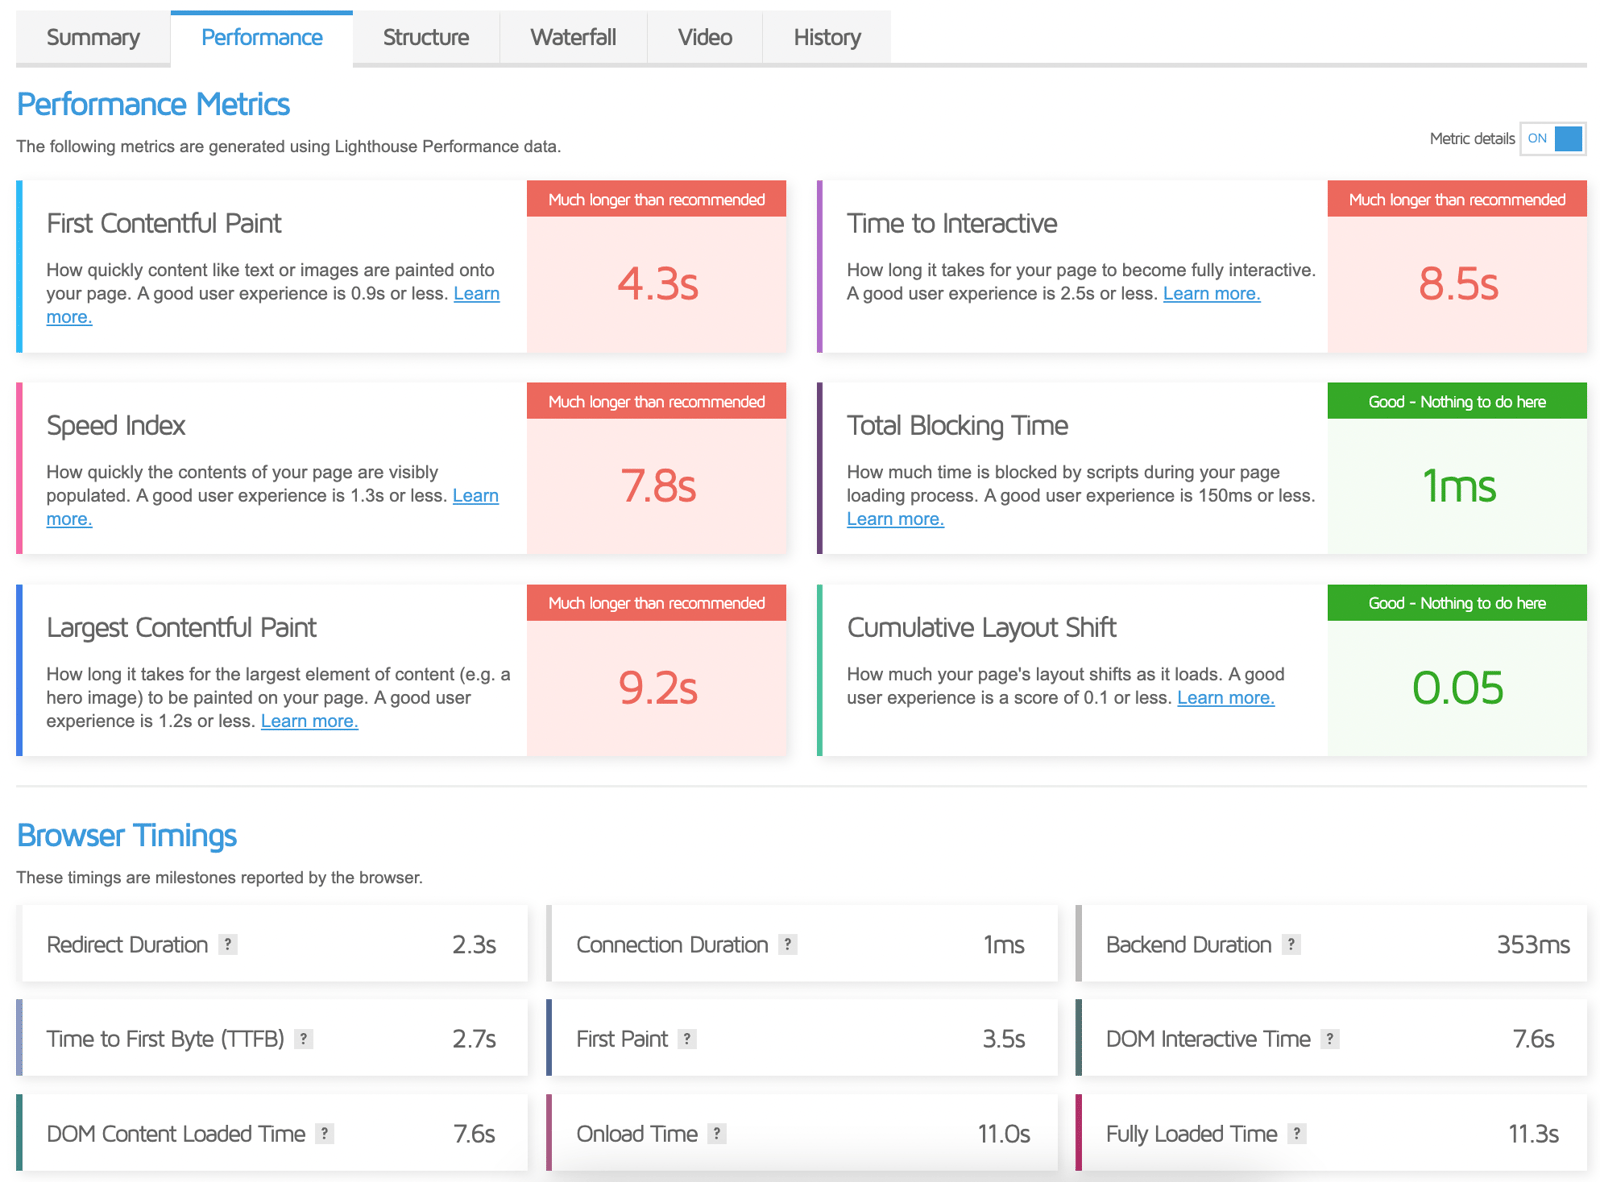
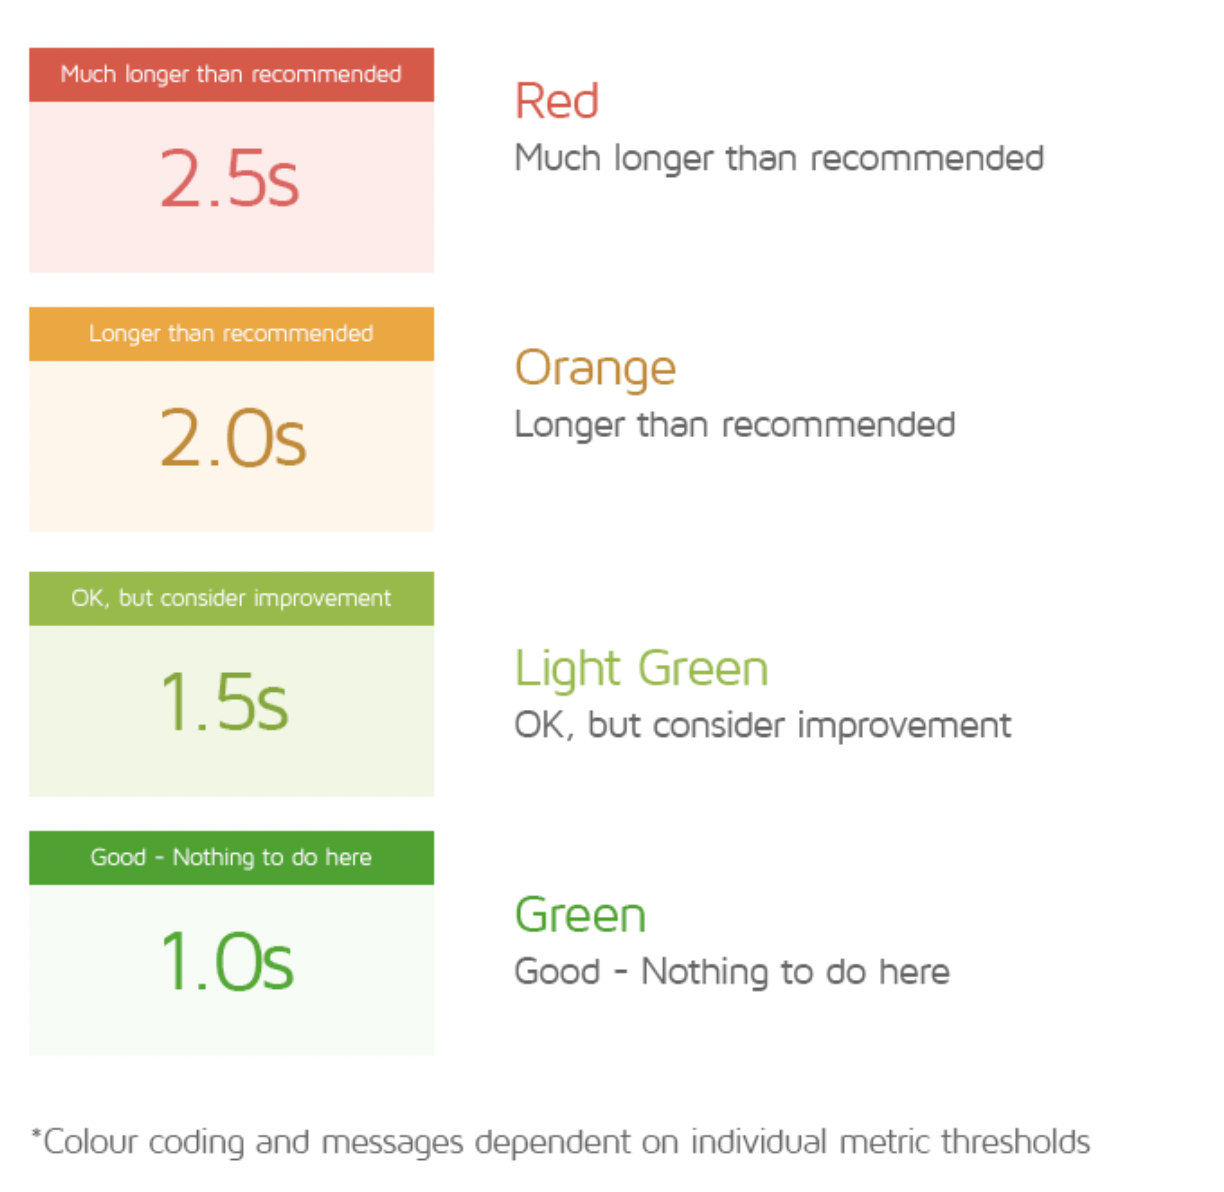
Here, you'll see colors and messages that reflect how your site performs on the metric being calculated.
Structure Score
The Structure Score shows how well your page is built for optimal performance.
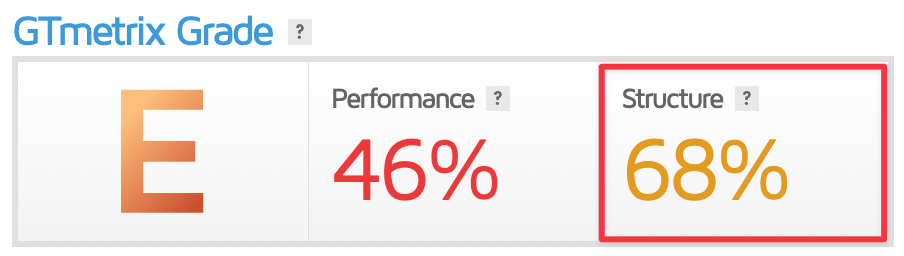
Beyond the standard Lighthouse scores, GTmetrix runs its own checks on web performance, and those checks live under the Structure Score section.
You can find detailed information on the Structure Score under the Structure heading, where you'll see a report like the one below, with the most serious issue listed at the top.
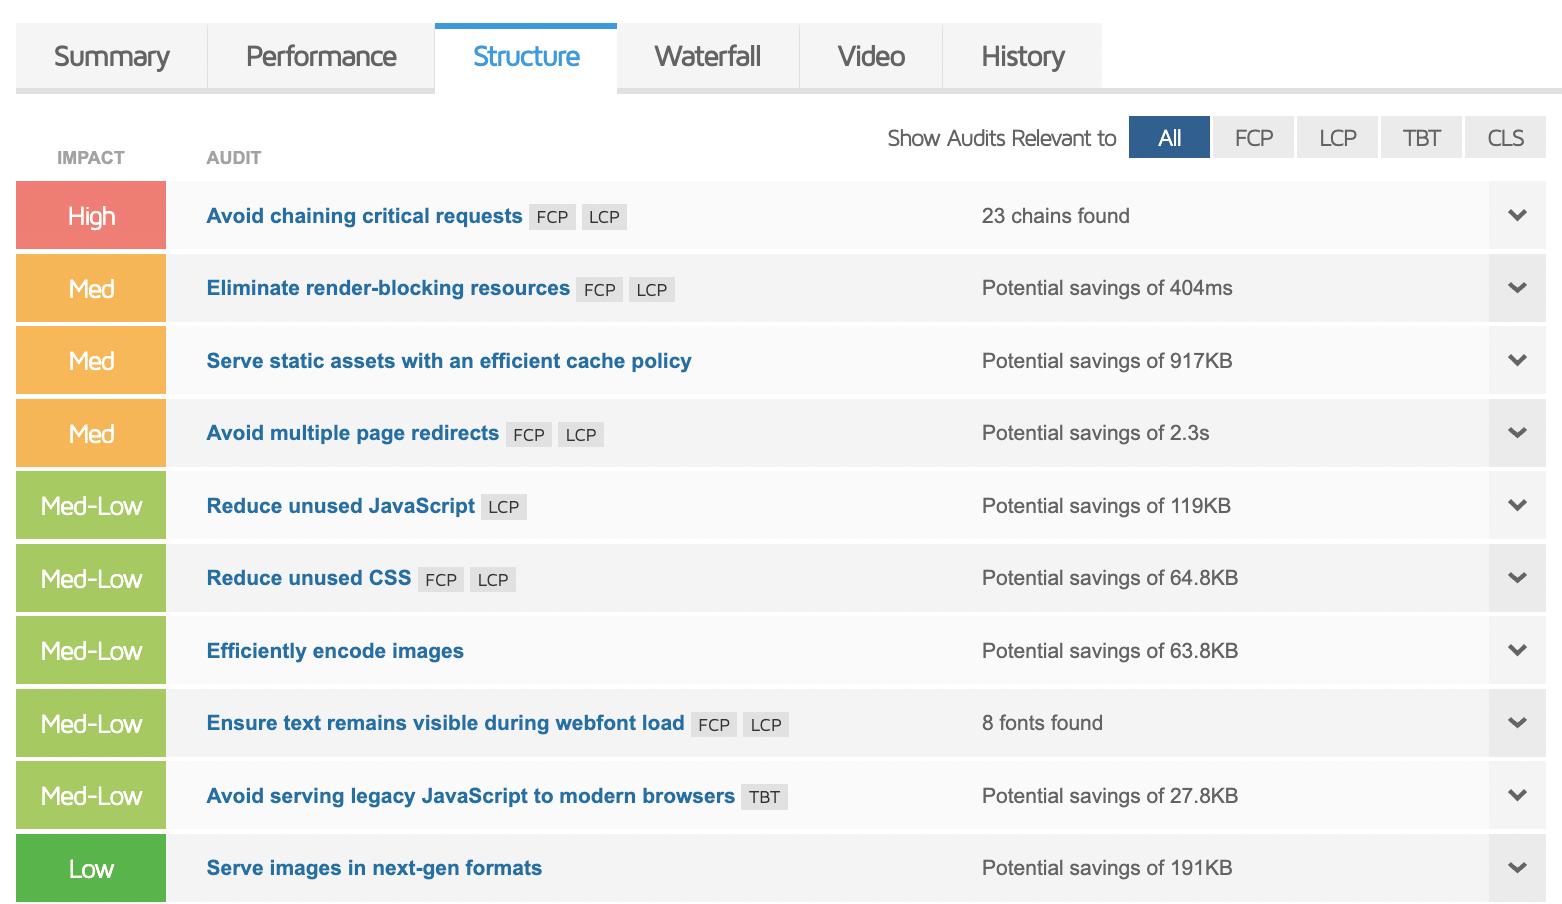
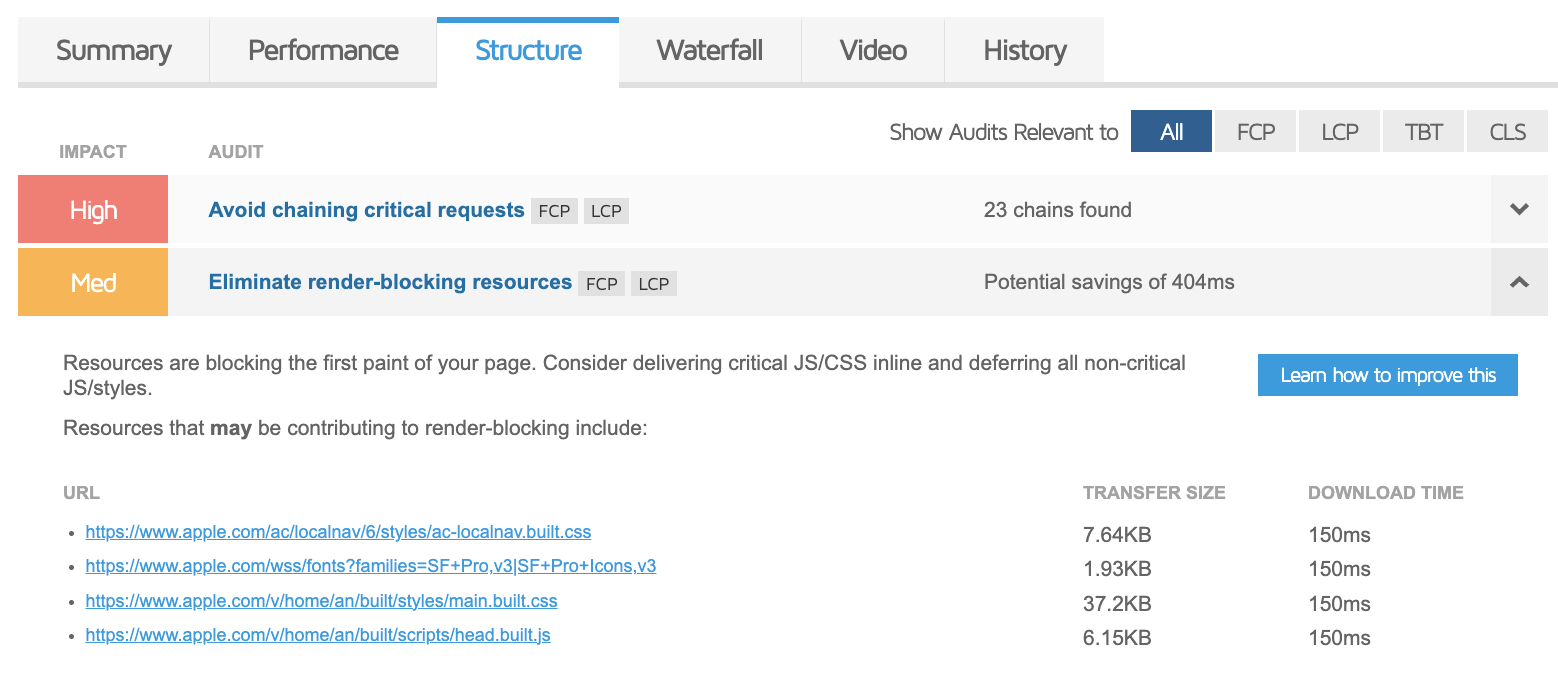
Click any question's title for a more detailed explanation.
We can read the items in this table by their color, as follows.
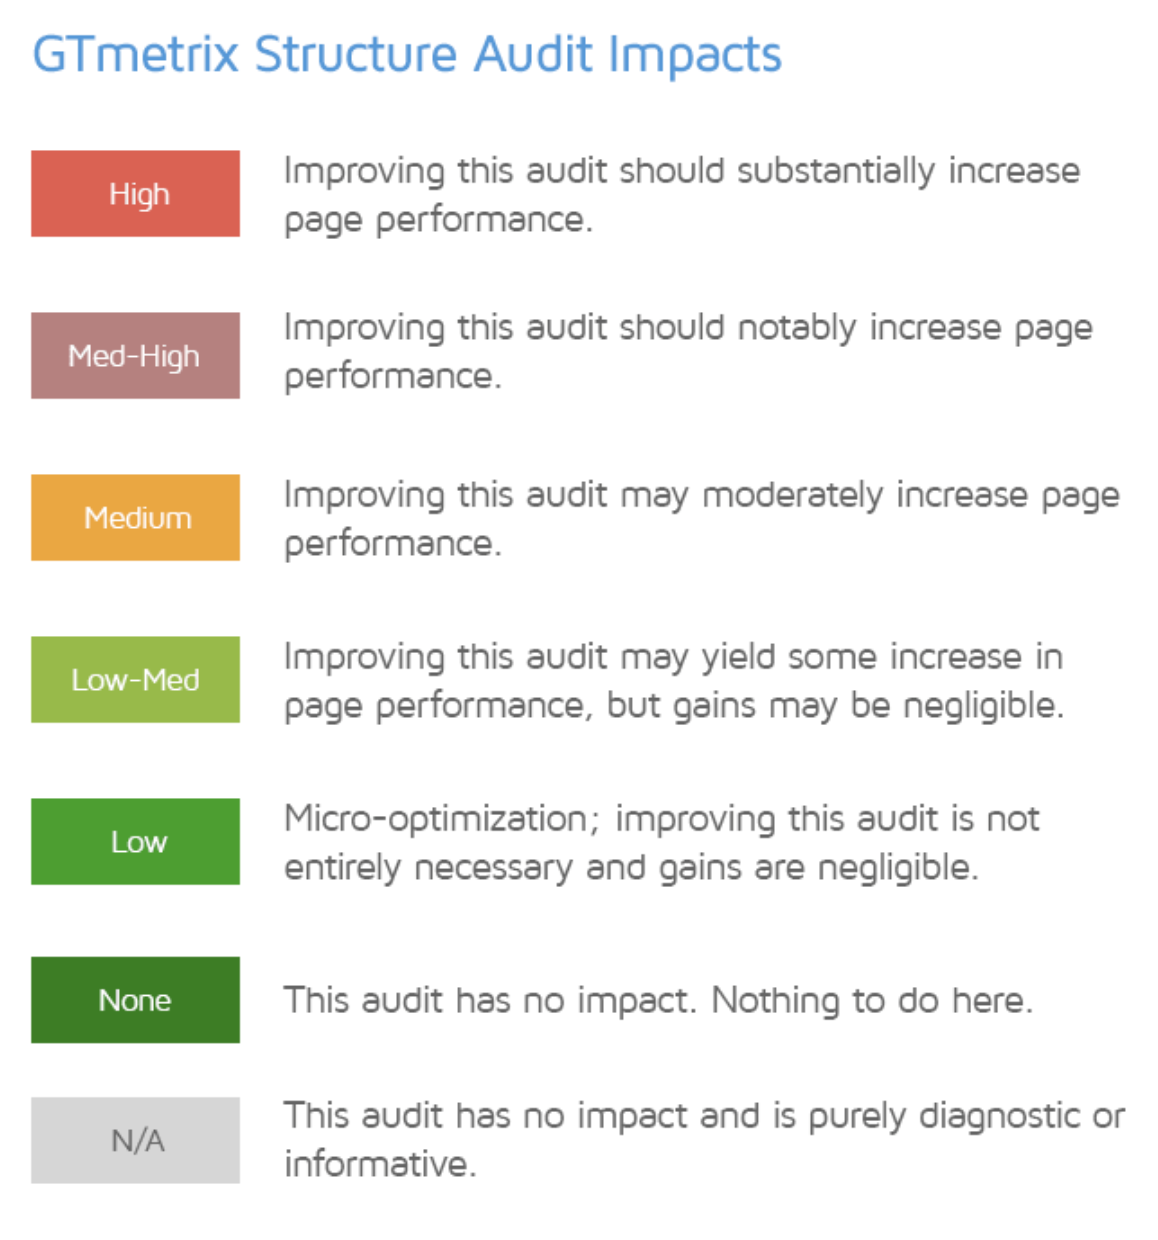
Fixing items marked 'High' and 'Med-High' will noticeably improve your page's performance, while fixing items marked 'Medium' will move the needle less. Since High and Med-High items carry the most impact, it makes sense to prioritize them first and start your improvement work there. Items marked in green mean you're already in good shape, so working on those won't have much direct impact on your page.
Web Vitals
In May 2020, Google announced the key metrics to focus on for faster site performance through Core Web Vitals.
GTmetrix gives us the following values through its tests, aligned with these metrics.
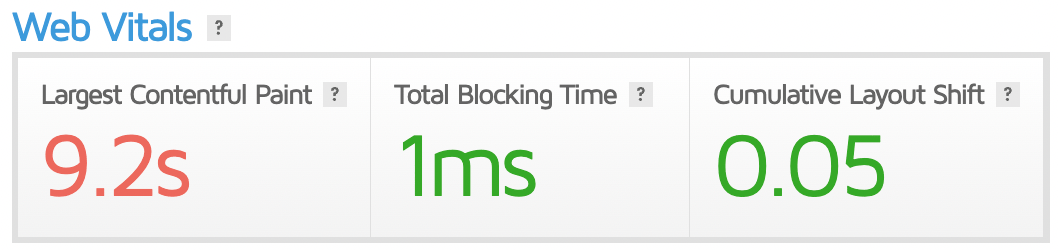
Briefly, on these metrics:
Largest Contentful Paint (LCP) measures how long it takes to display your largest piece of content; Total Blocking Time (TBT) measures how much time gets blocked by scripts during page load; and Cumulative Layout Shift measures how much layout shift your users experience while your page is loading.
The Summary Tab
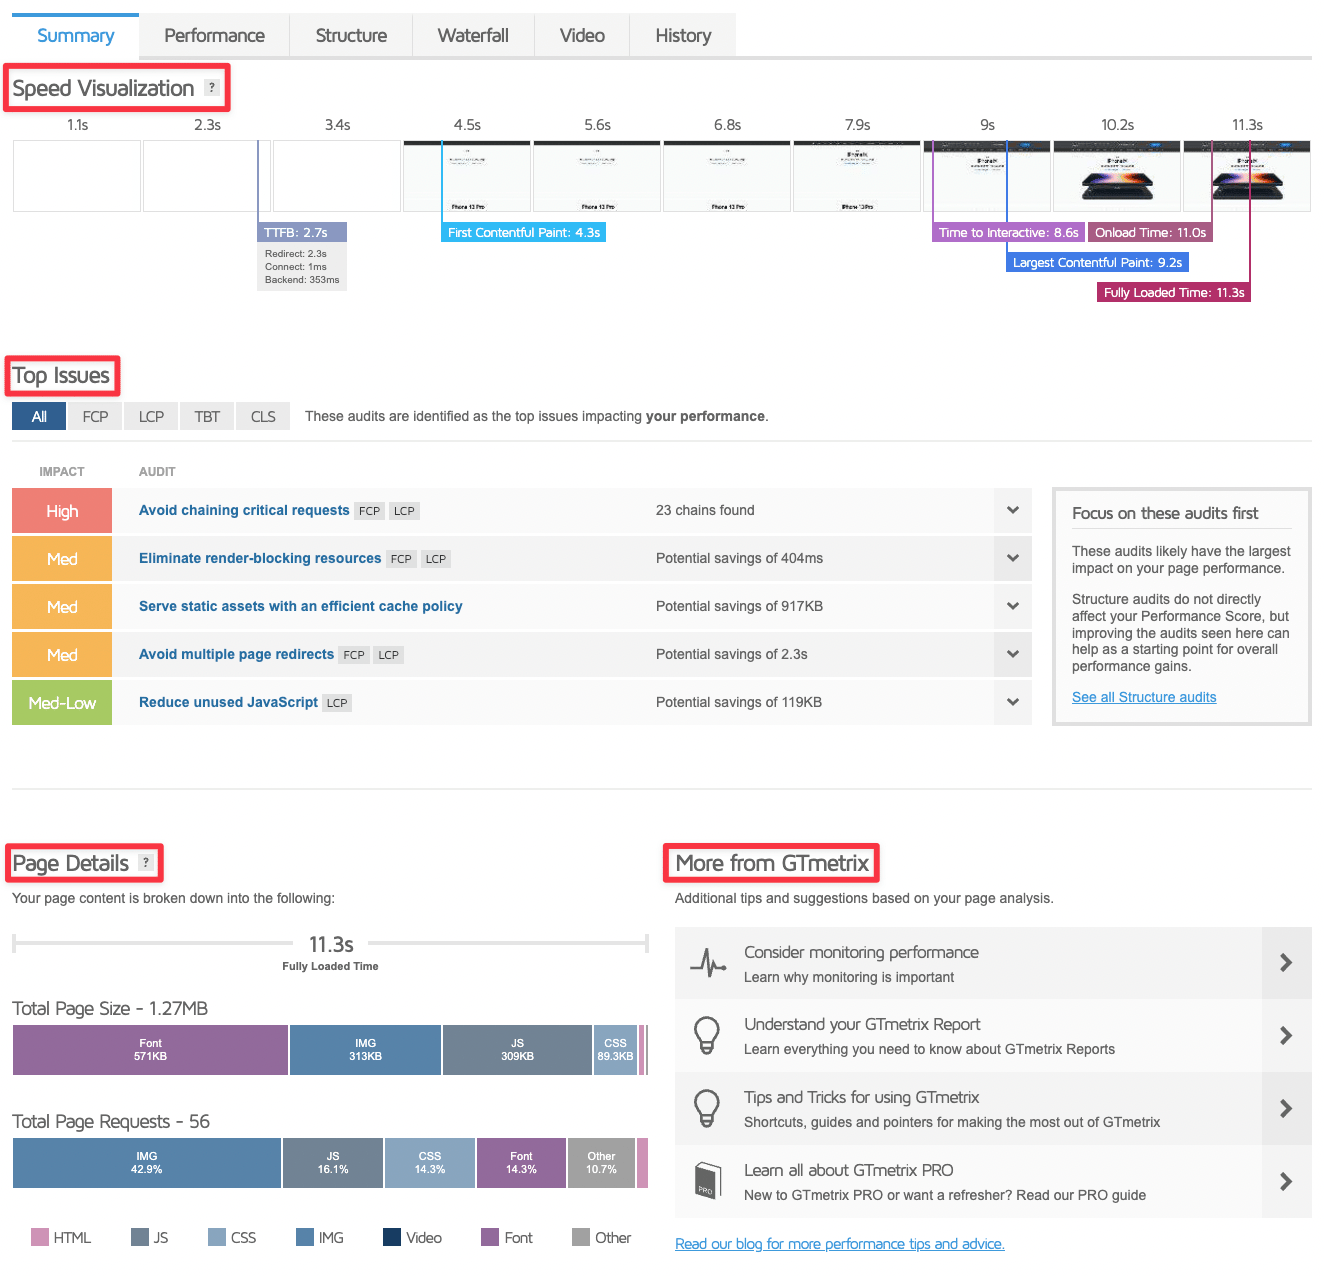
In the Summary field, GTmetrix gives you a summary view of your page's performance and load behavior. The problems and solutions shown here are usually enough on their own to improve page performance, so you can treat this as a source of action items in the site speed reports you build with GTmetrix.
At the top of the Summary area sits the Speed Visualization section, where you can watch the user's experience unfold as your page loads.
Below that, the Top Issues area shows the problems affecting your page's performance and offers suggestions, much like PageSpeed Insights. As you fix the issues listed here, you can track your site speed improvements by retesting with GTmetrix.
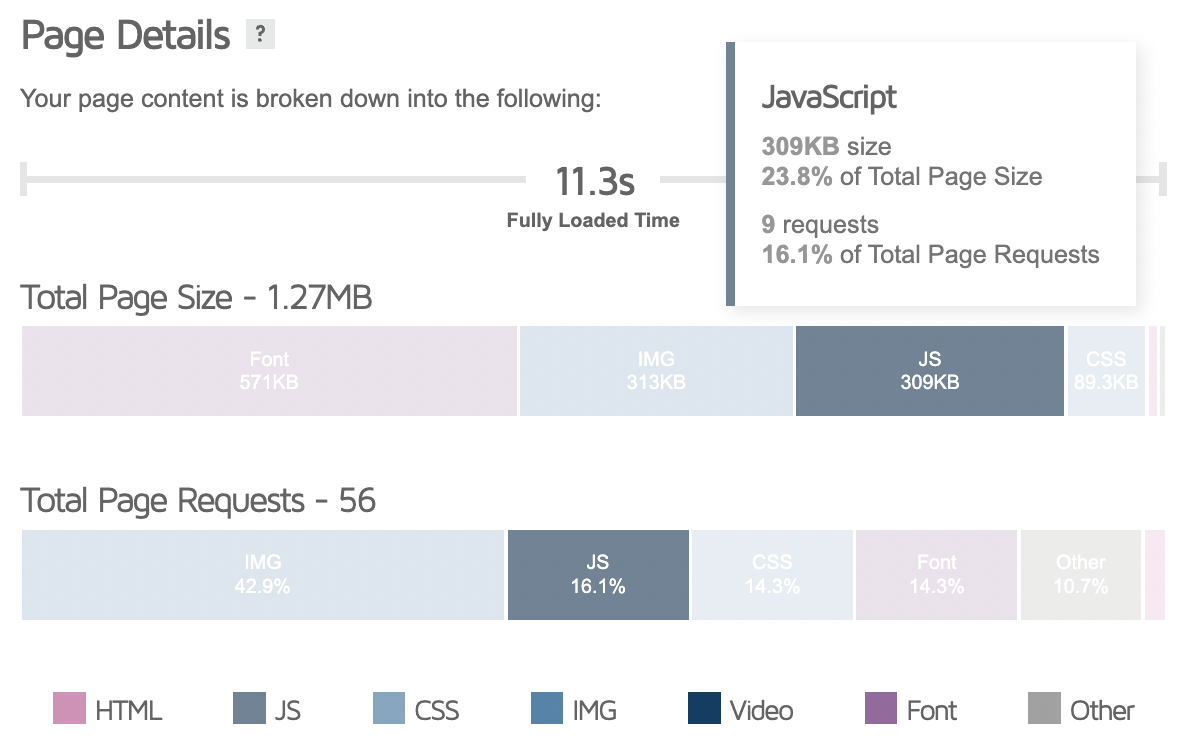
In the Page Details area, you can see the number and type of requests your page makes, along with the size in bytes each one generates.
From the Page Details section, hover over any item to get a more detailed description.
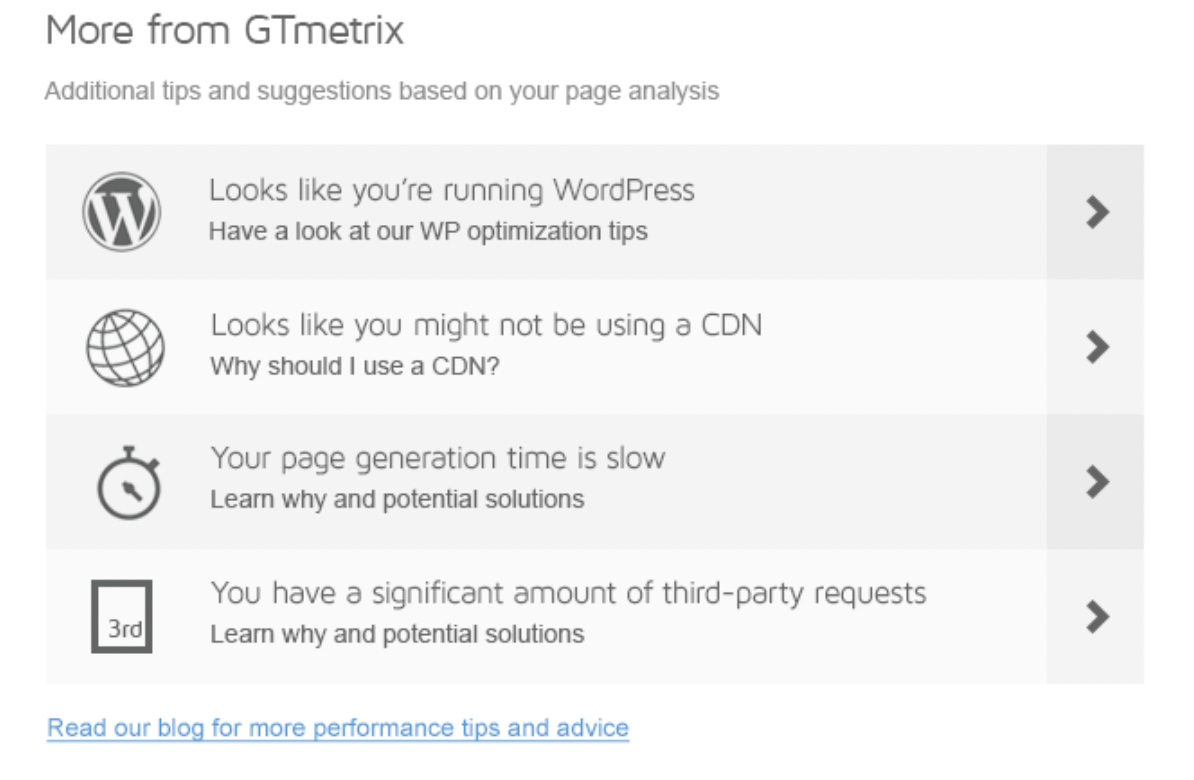
The last section in the Summary area is More from GTmetrix, where GTmetrix offers suggestions based on what it discovered while testing your site. If it detects you're running on WordPress or Shopify, for instance, you'll get solution suggestions specific to that infrastructure.
The light brown areas under the Waterfall header point to files with blocking behavior, and those files are worth reviewing for optimization.
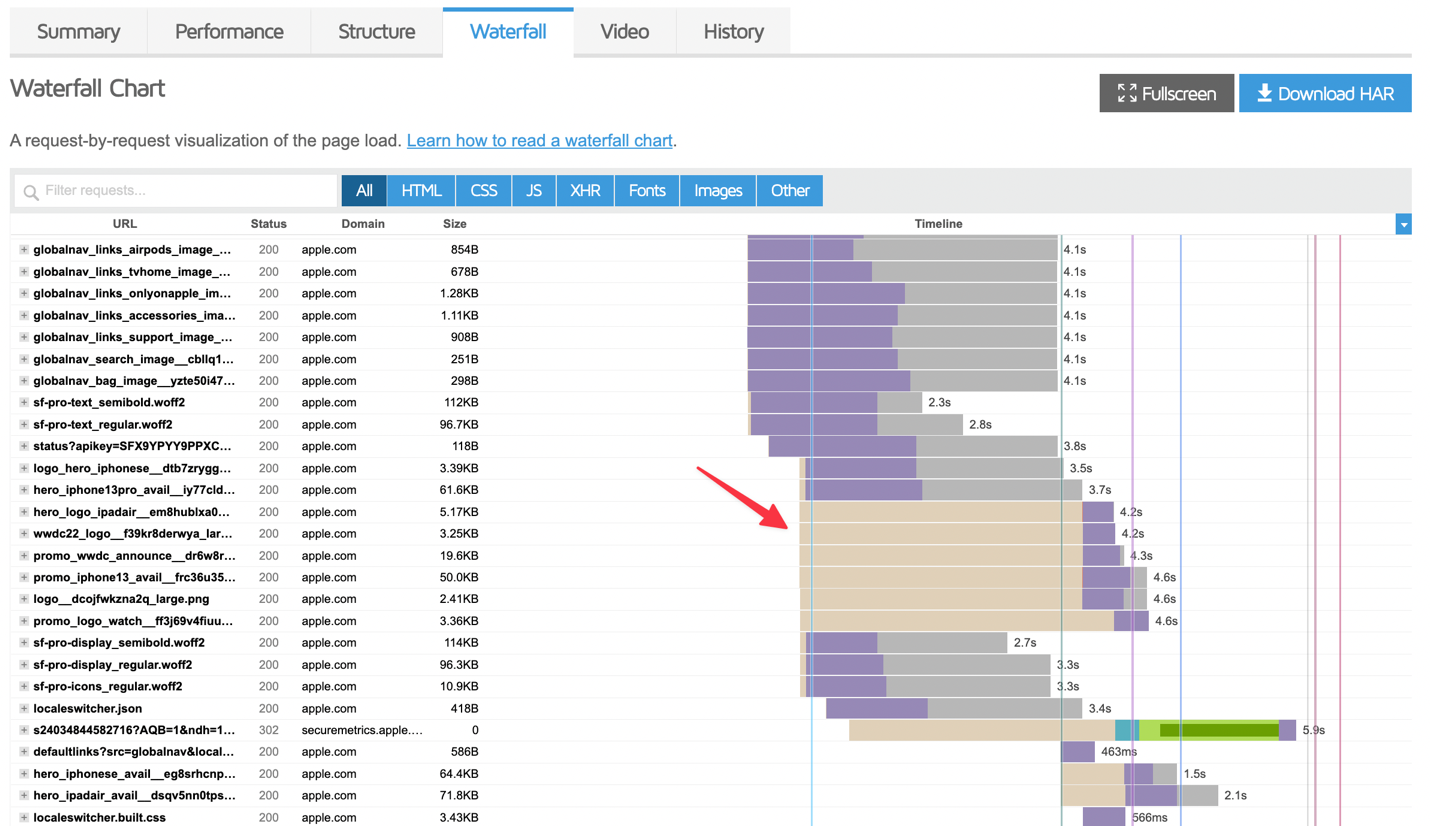
You can also access the waterfall through your browser's Network tab by right-clicking and choosing Inspect, though I find GTmetrix more useful for this.
I hope this post, where I tried to touch on plenty of important points, was useful to you. See you in the next post. :)
Resources:


