


Google Analytics 4 has now completely replaced Universal Analytics. So what will happen to our years of data accumulated in Universal Analytics? Google has announced that Universal Analytics data will be stored until 1 July 2024 and then removed indefinitely. This is worrying for many businesses and digital marketers. Many brands we consult with are opting out of Universal Analytics if they don't have a lot of historical data, but for brands that have been accumulating data for years, it's the opposite.
In order to guide you, we will explain one of the best ways to solve this issue in our article. First of all, there is no single way to do a "Universal Analytics Backup." There is more than one method we can apply. These methods, as suggested in the Google source, are as follows:
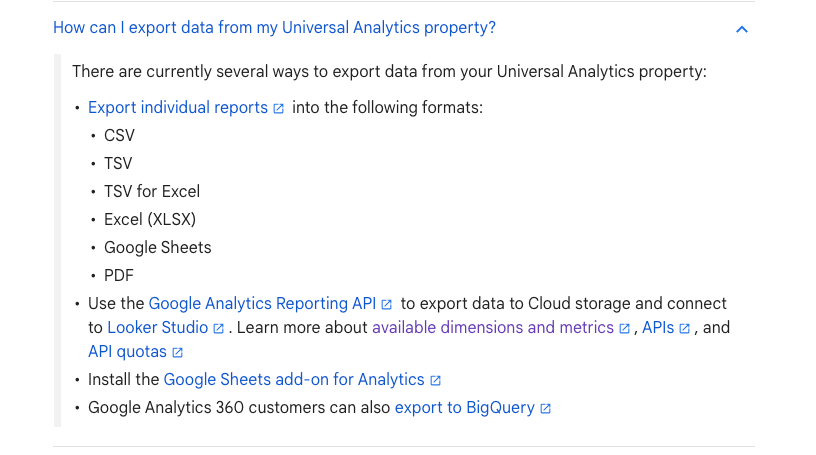
In this article, we'll walk through the export method using Google Sheets, then visualize what we've stored with Looker Studio. Google Sheets is a reliable, cost-free way to back up your Universal Analytics data, and once it's saved, you'll always have access to it for future work. Whether you're analyzing site traffic or tracking user behavior trends, this backup becomes a valuable resource for growing your business and refining your strategies. Without further ado, here's a step-by-step guide on how to do it.
Step 1 - Log in to your Google account where your Analytics account is located
Here, I recommend doing this in an incognito tab, since the plugin we'll cover later might not work correctly when you have more than one Google account open.
Step 2 - Select the Universal Analytics view to back up and open a blank Google Sheets.
This will be where you will back up and organize your Universal Analytics data.
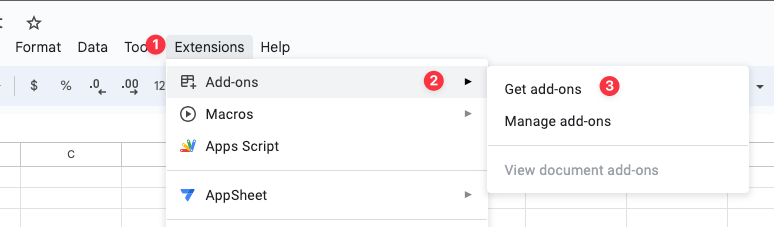
Step 3 - Extension.
Follow these steps from the Extension menu: Extension > Add-ons > Get add-ons.
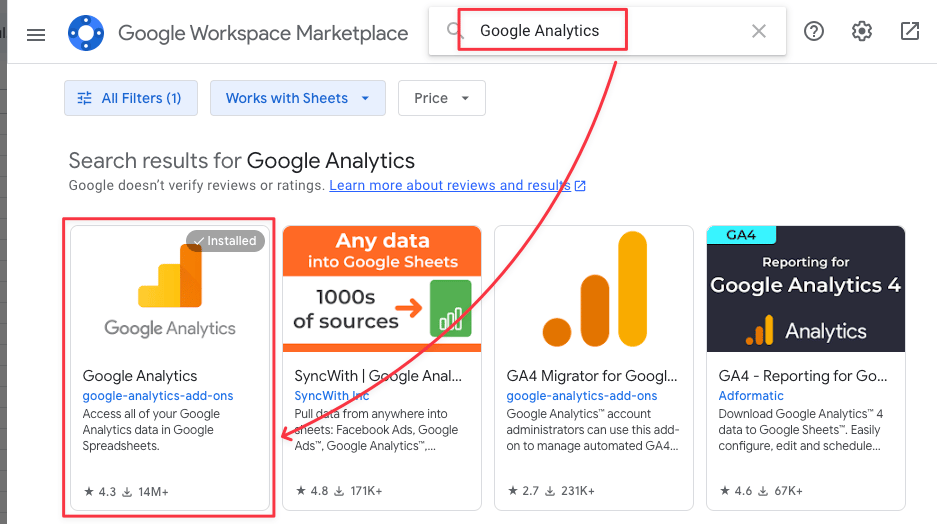
Step 4 - Find the "Google Analytics" plugin in Google Workspace.
In the search section, install the plugin that will appear when you type "Google Analytics" as in the image. It shows as "Installed" because I have it installed.
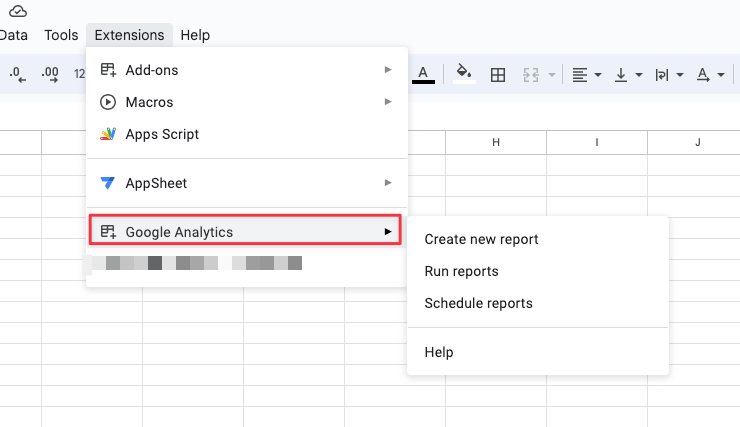
After granting the permissions and installing it, it should appear under the Google Sheets extension menu as shown below. If not, you can refresh the page once.
Step 5 - Open your most used report screens in Universal Analytics.
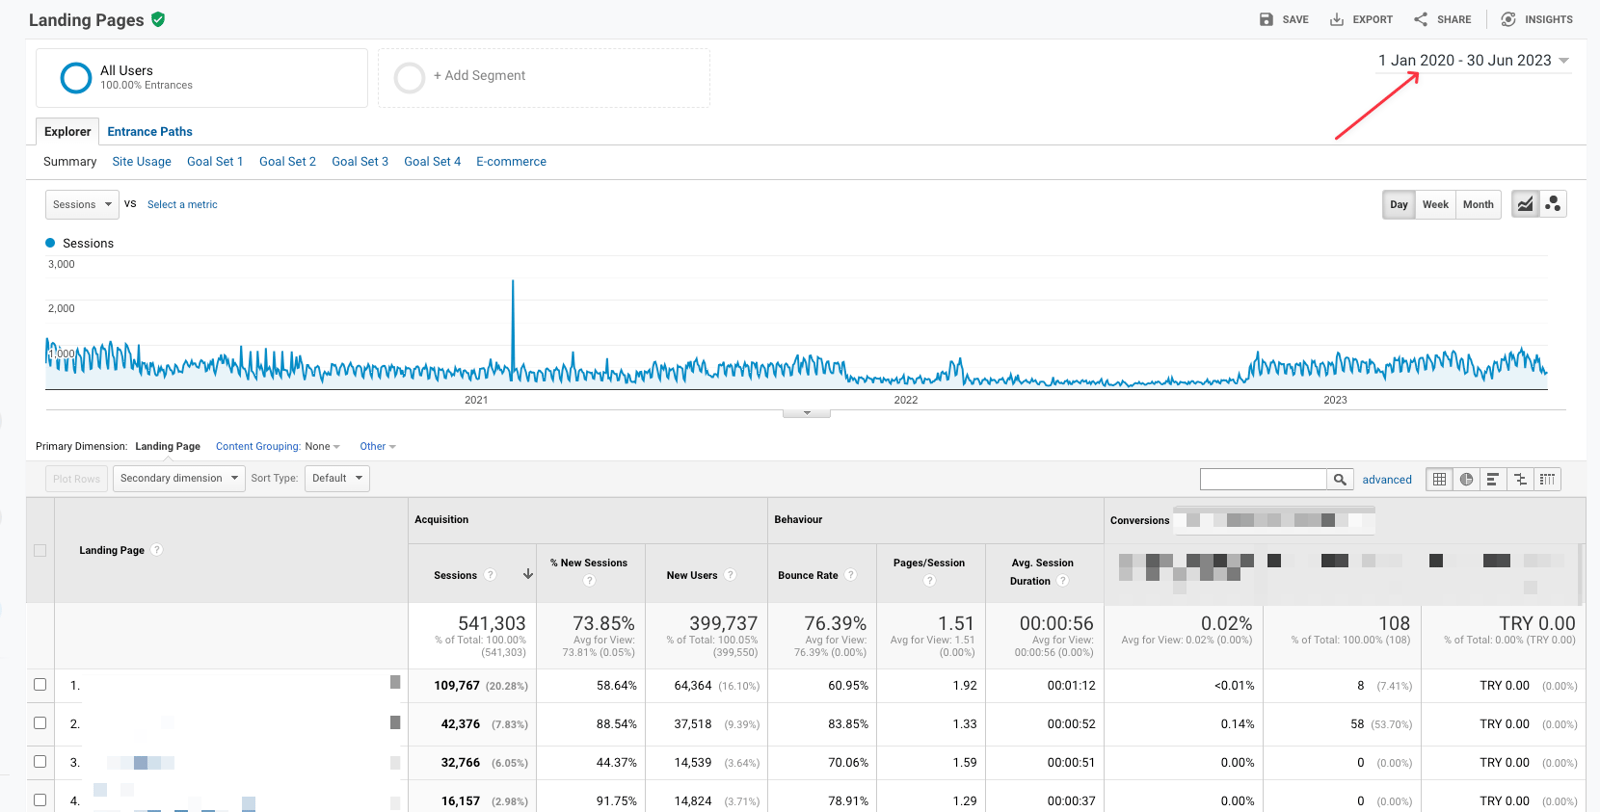
Since there are many report screens, you should prioritize the reports you use the most in order to manage your effort and time efficiently. I chose the "Landing Page" report, which is one of the most used reports. Then, I set the date period between January 1, 2020 and July 30, 2023. I'll make a 3.5-year backup, since I think this is a very good period to analyze a website. You should adjust the date here to suit you.
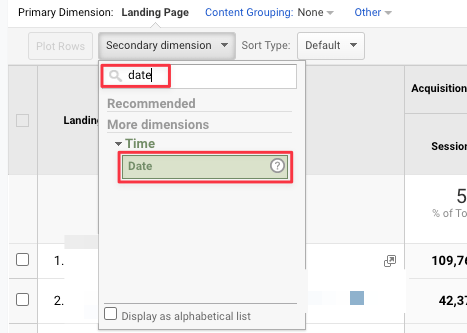
Step 6 - Add "Date" as Secondary dimension.
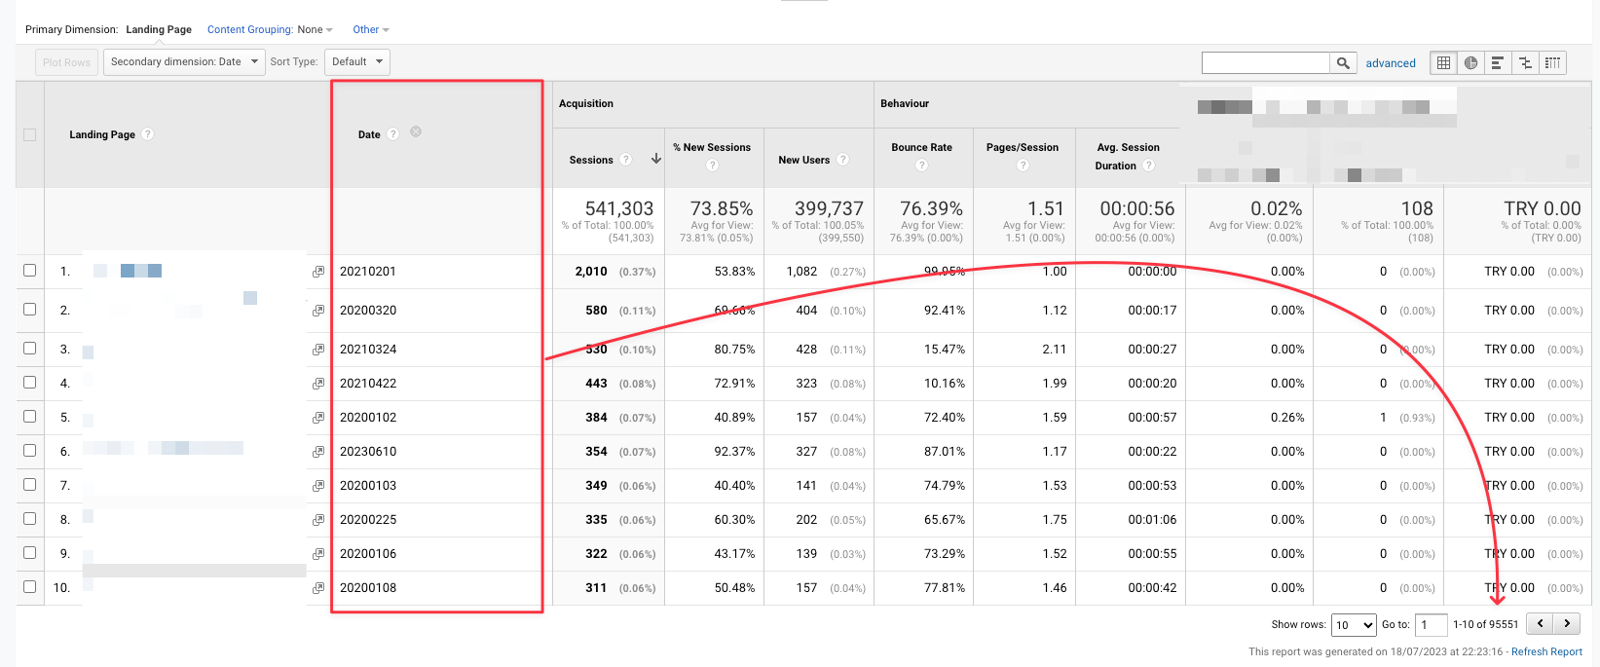
When you add date on the secondary dimension, it will separate all pages day by day and therefore increase the number of rows. Pay attention to the number of rows below. If you're a site with a lot of data, some problems may occur after 100,000 rows. For me, this number is "95551", so there is no problem.
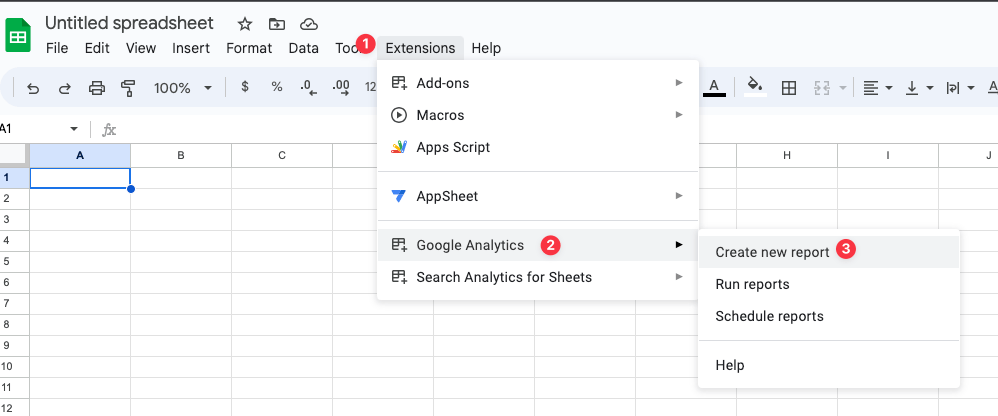
Step 7 - Select "Create new report" on the Google Analytics plugin.
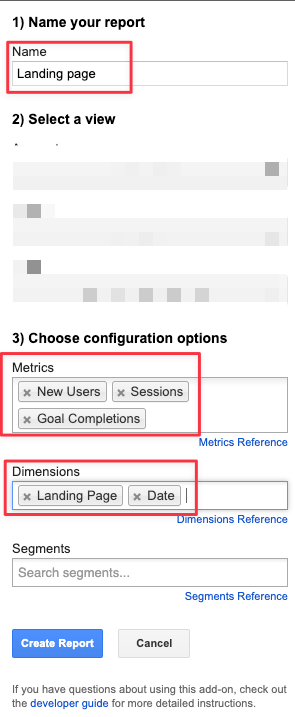
Step - 8 Create the report by selecting Dimension and Metric.
Afterwards, we can select our dimension and metrics, give a report name and say "Create Report".
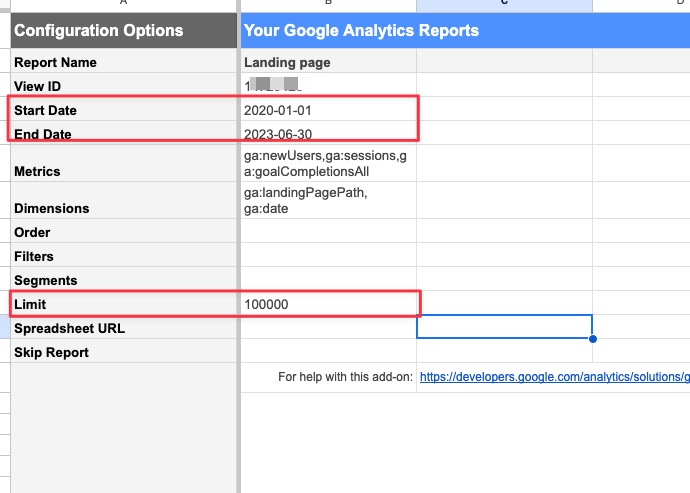
Step 9 - Set the date and limit.
Update your date period and limit as follows.
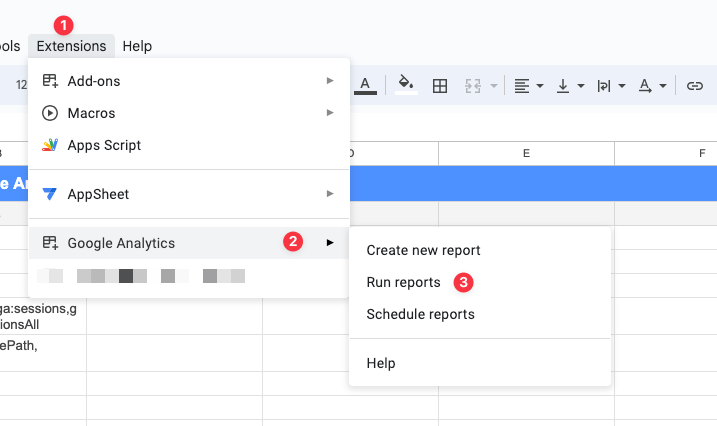
Step 10 - Run reports
We can say "Run reports" by following the steps in the image.
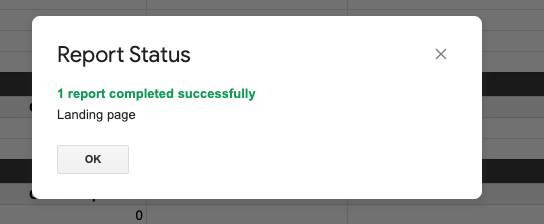
If we see the screen below, we can say we succeeded.
After the above screen, our file should look as follows.
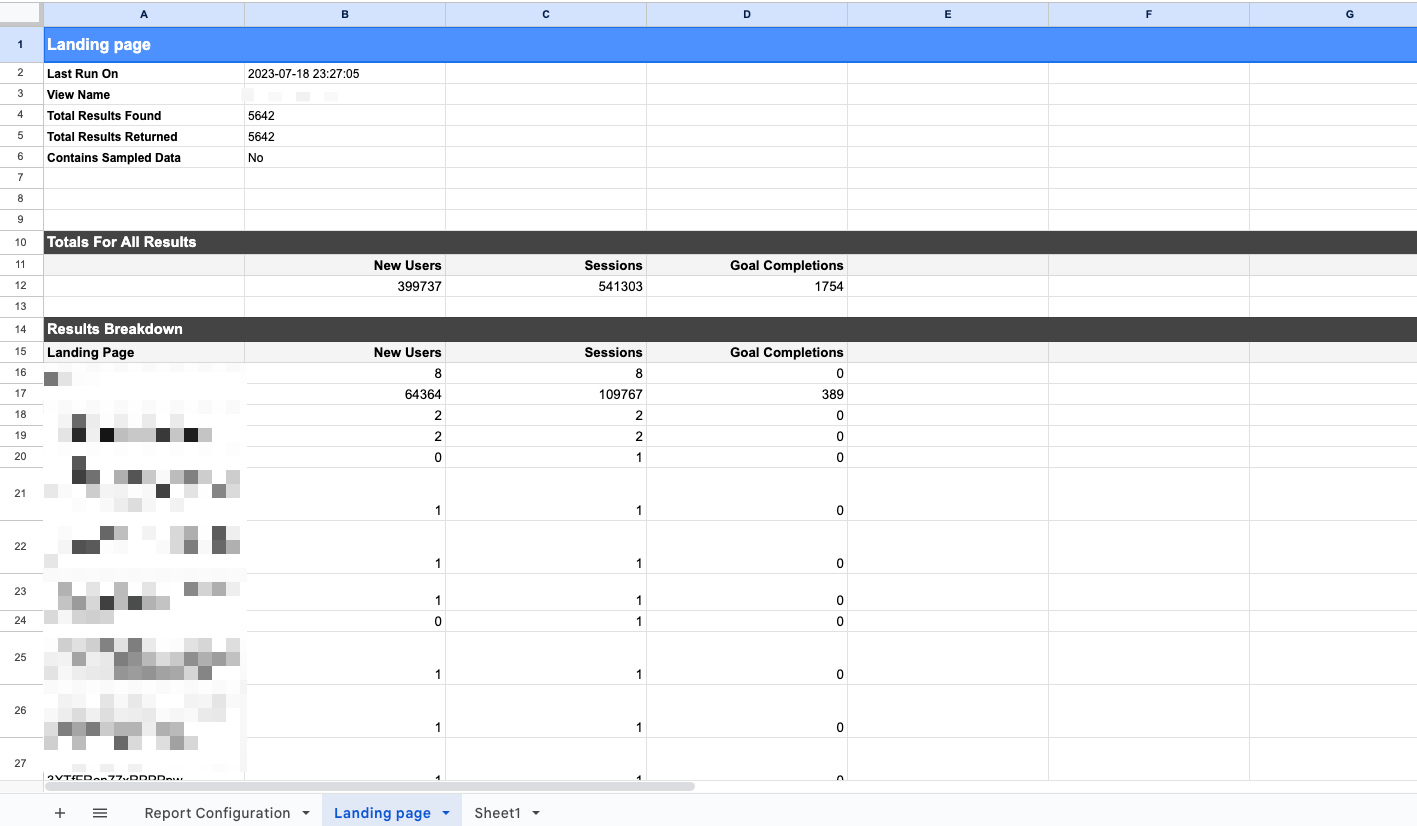
In 10 steps, we have stored our data. Now we move on to the process of visualizing this data. We will do this with Looker Studio.
Step 11 - Open Looker Studio in the same Google account.
From the Looker panel that opens, let's open an empty report by saying "Blank" and directly select "Google Sheets" as the data source.
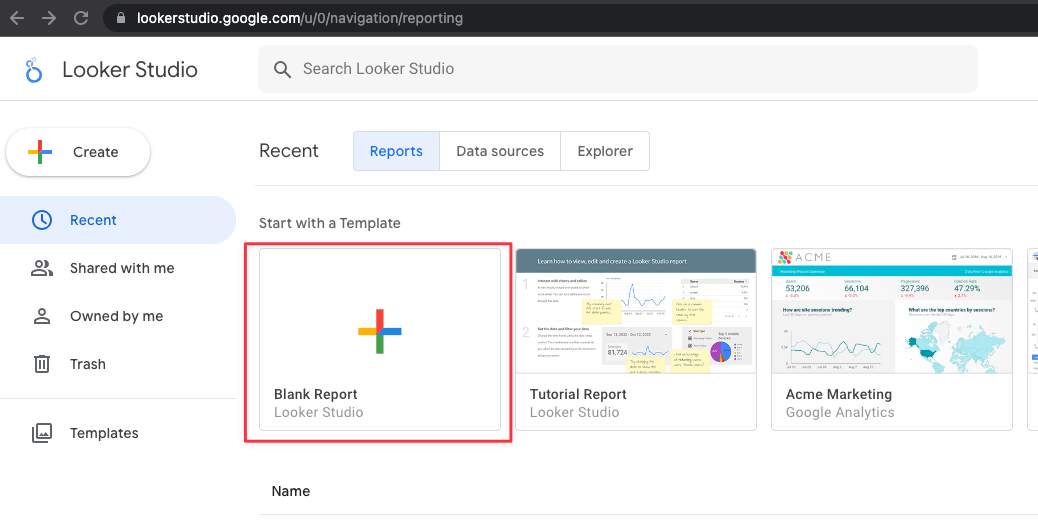
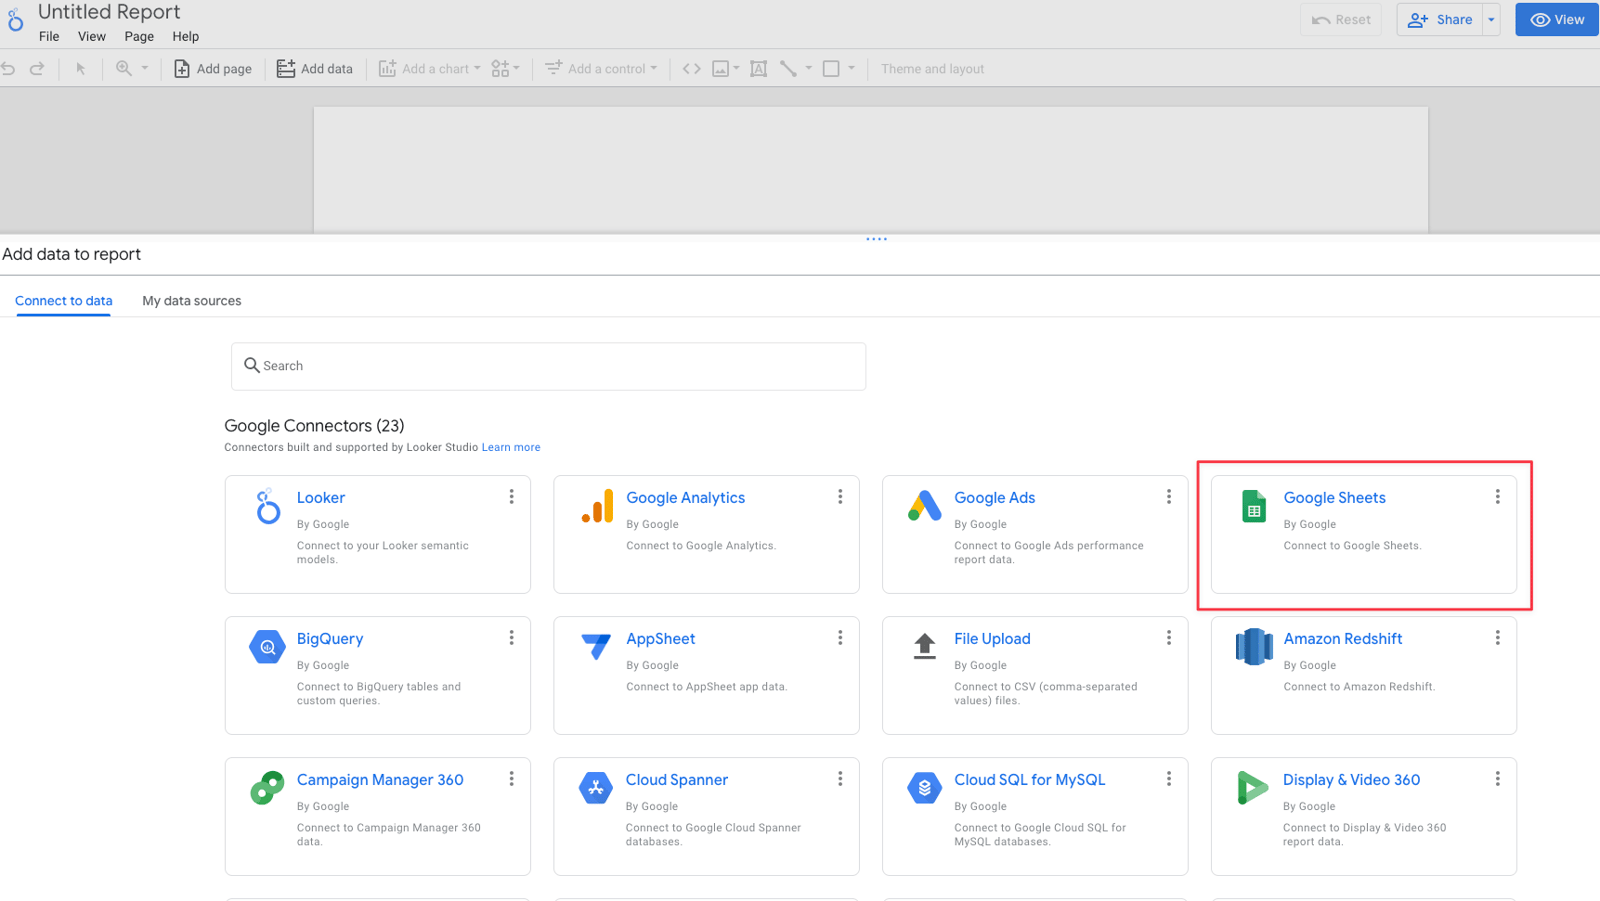
Step 12 - Let's specify the report we created as data source.
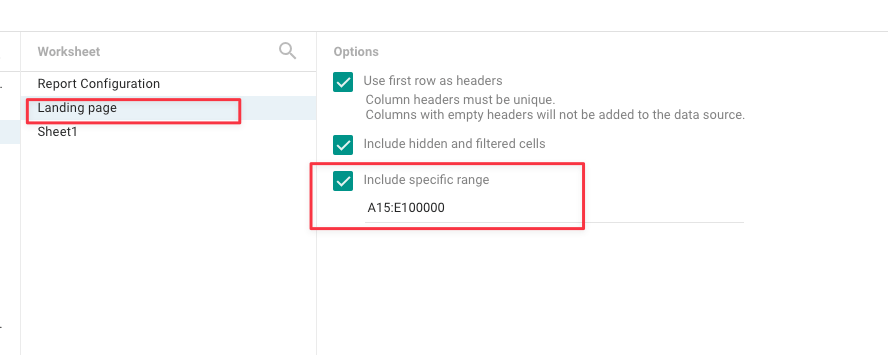
Let's select "Landing page" in the sheet we created as data source.
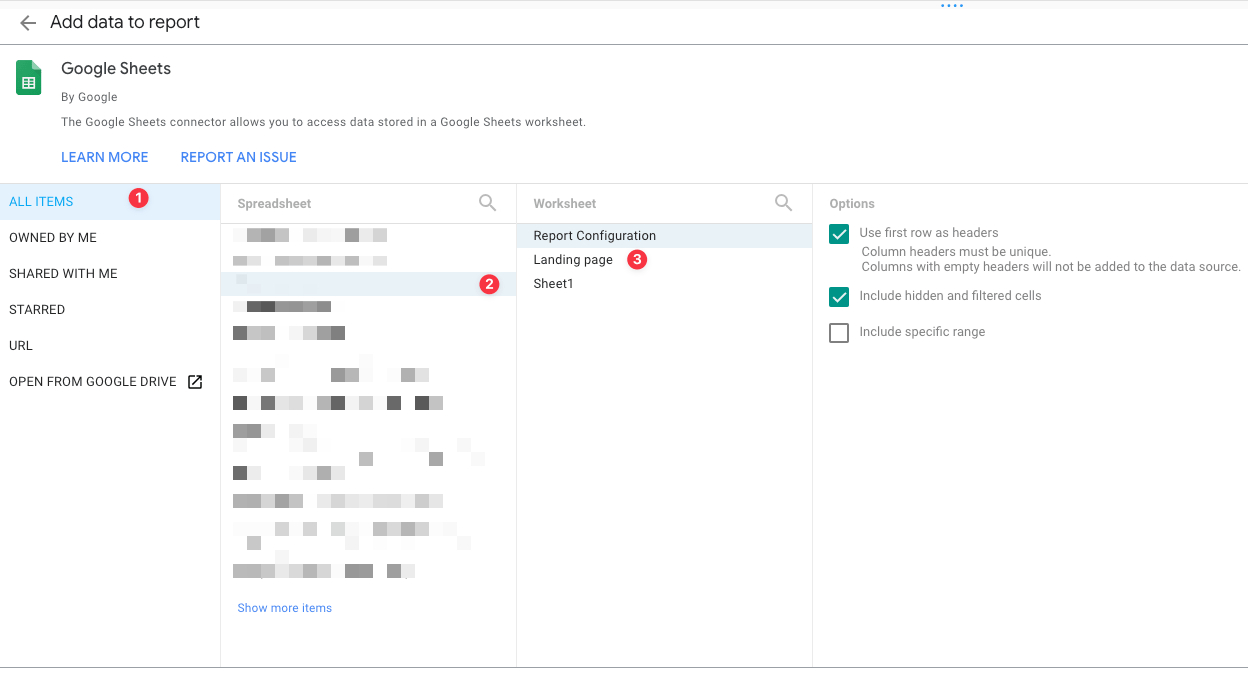
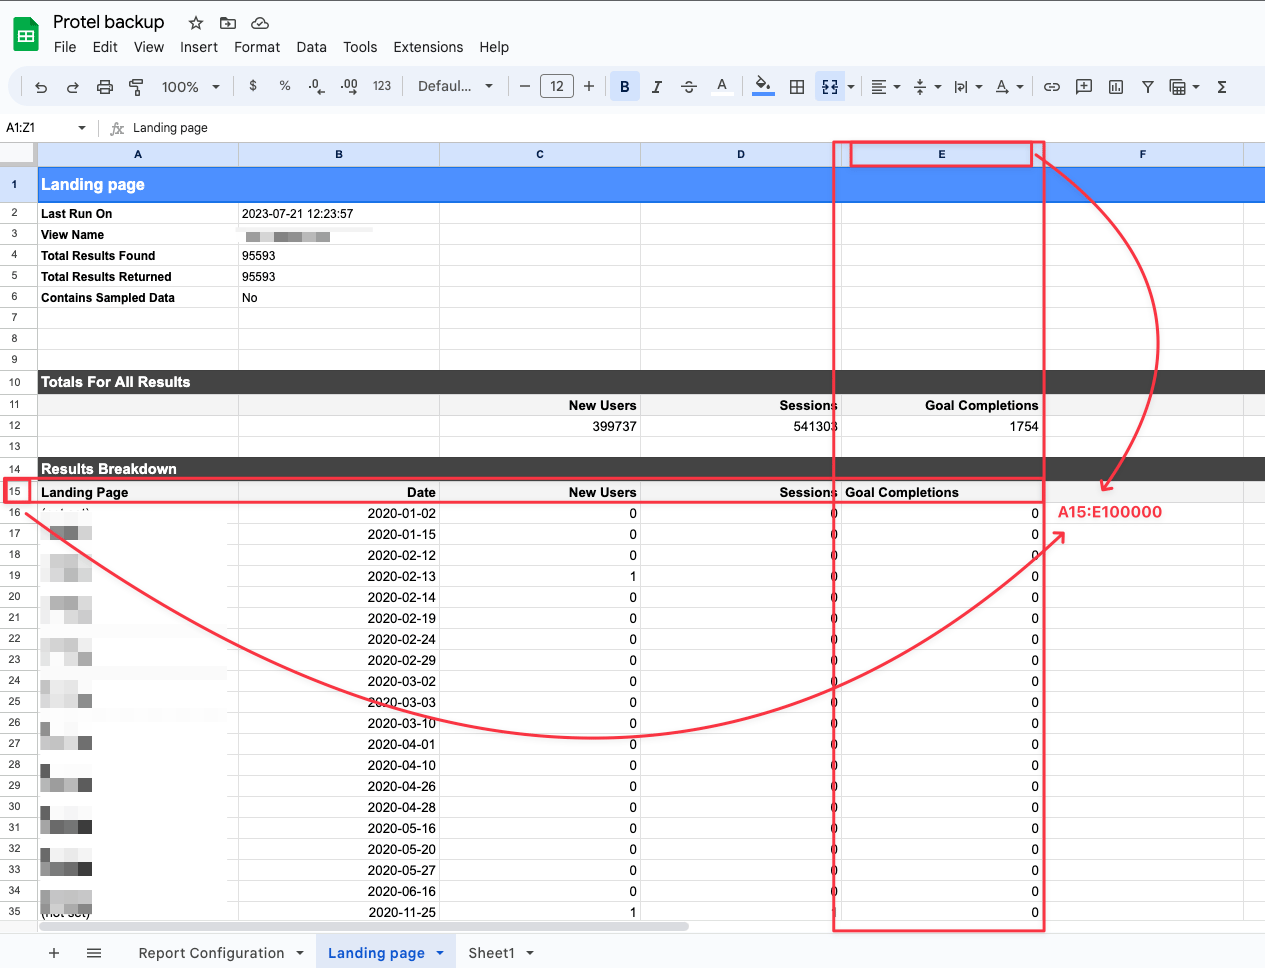
After doing this, there is one more important setting we need to make. We need to specify rows and columns specifically by putting a tick in the "Include specific range" section. For me, this information is as follows; your column value may change according to the number of metrics.
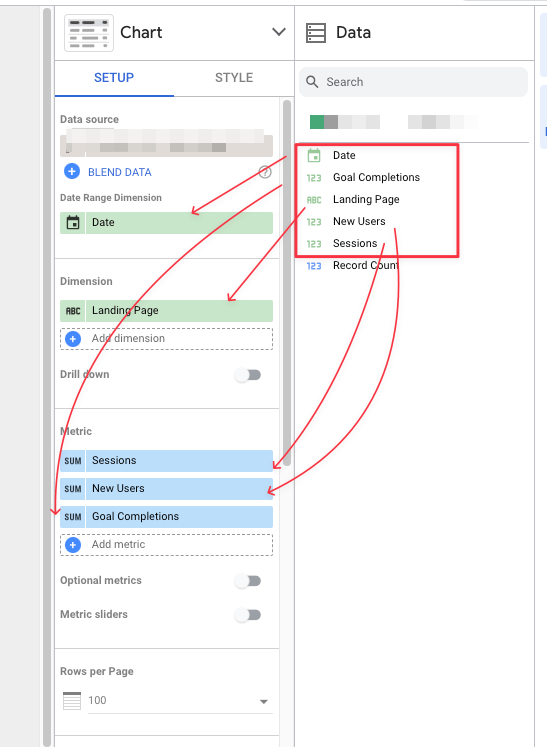
Step 13 - Let's set the metrics.
When we do the above operations and create the report, an automatic table will be created as below. We should set our metrics as I have marked.
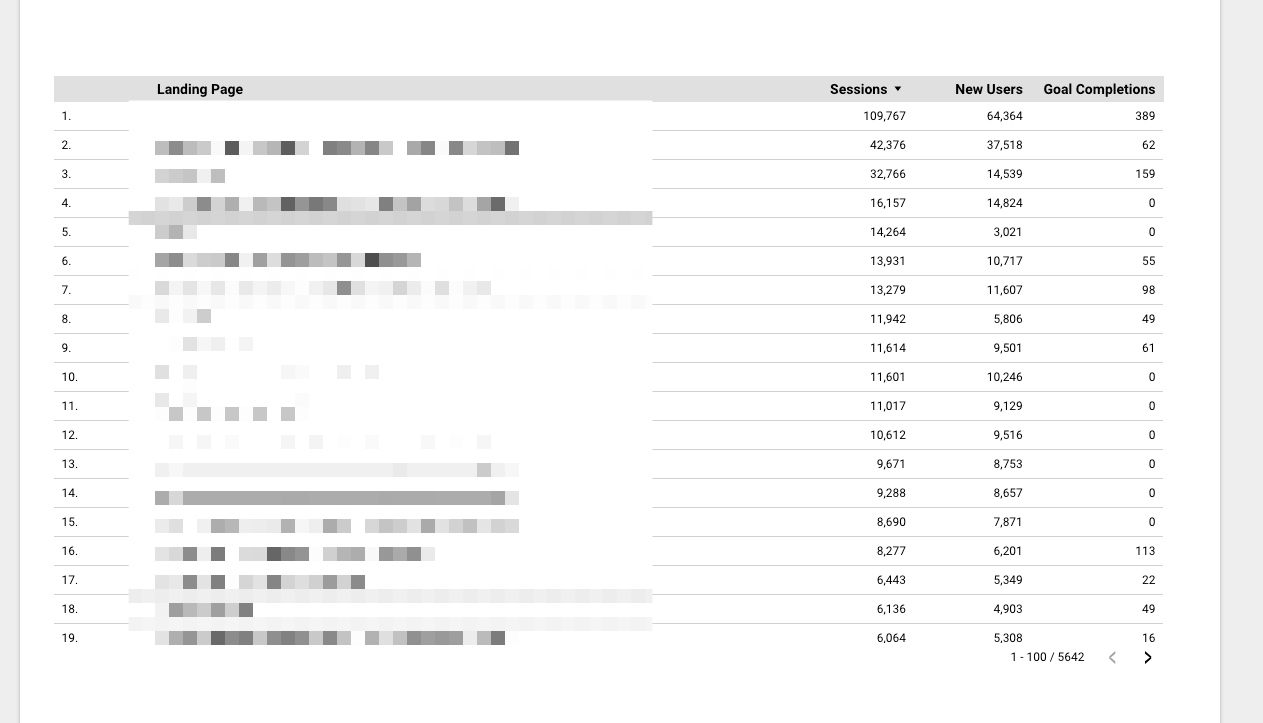
We got a table view like the one below. Everything looks fine.
Step 14 - Add date control
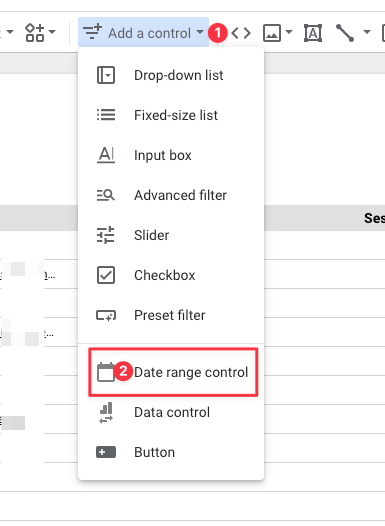
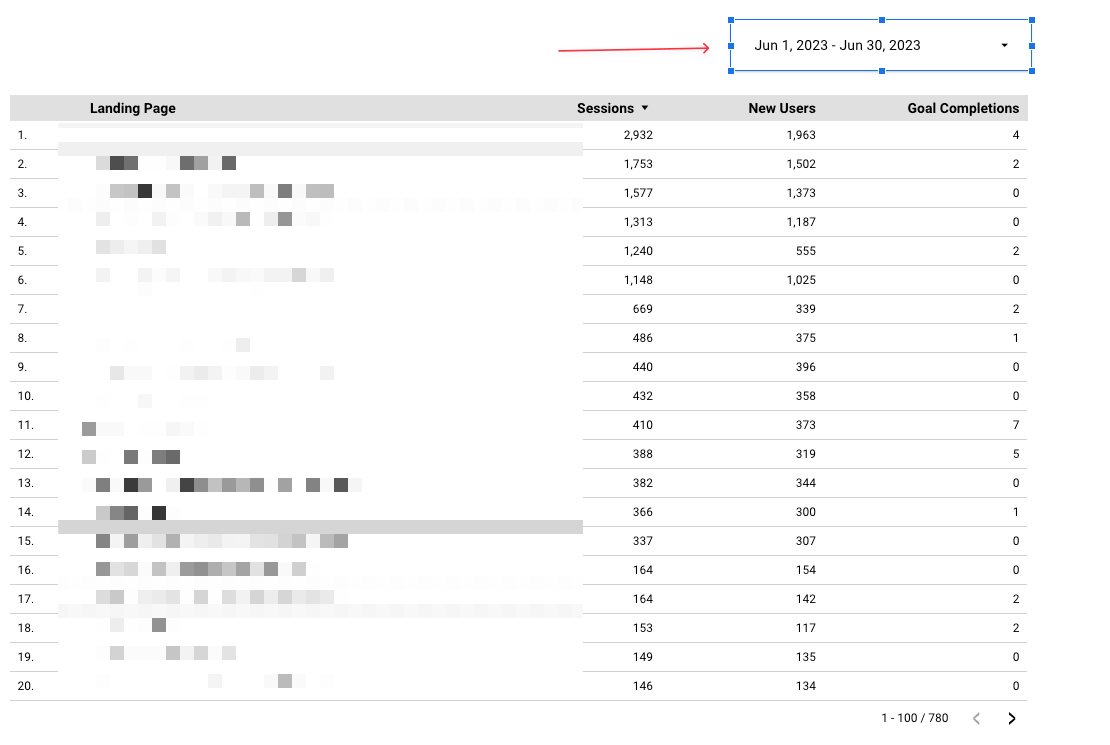
After adding the date control, the data in our report will start to appear according to the date period we set. Congratulations! We were able to backup our landing page report together!
Last Word
In our content, we have tried to provide a detailed guide on why backing up Universal Analytics (UA) data matters and how you can achieve this, with a particular focus on backing up Landing page reports. For many companies and individual users, this can be a critical way to protect and track valuable user data.
Although the manual process of backing up may seem time-consuming, it is worth it to avoid the risk of data loss and to keep a complete overview of your statistics. Identifying which reports are important to you and backing them up at regular intervals can prevent data loss while keeping your analytics accurate and reliable.
Which data you prioritize in your backup process depends entirely on your own needs, and it may vary depending on the specific project or goal. Building a backup strategy around those needs is what will make it most useful to you.


