


Reach & Frequency Optimization
Average frequency can hide the exposure pattern that matters most.
We set the frequency cap from the campaign's funnel stage, then break the average into an exposure distribution. That shows the difference between someone who saw the ad once and someone who saw it twenty times. We review reach and frequency together across placements and devices because a change to one reshapes the other. You end up with a frequency distribution you can explain, showing who is underexposed, who is overexposed, and what changed in response. For teams whose only frequency number is a single average nobody has ever broken down further.

Some of the 500+ brands we've worked with
Selected brands we’ve worked with across industries.













 GeneraliGlobalCase Study














 Albaraka TürkGlobalCase Study














































 OdeabankGlobalCase Study












On this page
How the work runs
Check the distribution before changing the cap
We begin with an agreed cap, build the exposure distribution and then check whether it moved after an adjustment. AI can compile and deduplicate large reach and frequency exports. The media lead sets the cap, and only the authorized owner can change the budget.
How we hold ourselves to it
- Set the frequency cap around the funnel stage
- Read the full distribution behind the average
- Deduplicate reach across placements and devices before reporting it
- Treat reach and frequency as one tradeoff
Set the cap to the funnel stage
Decide the frequency cap and reach goal from the campaign's role, whether it is meant to introduce, remind, or convert. Leave the previous campaign's default behind. Media lead and client owner approve the cap and reach goal.
Frequency cap and reach goal set from the campaign's role and recorded with the reasoning.
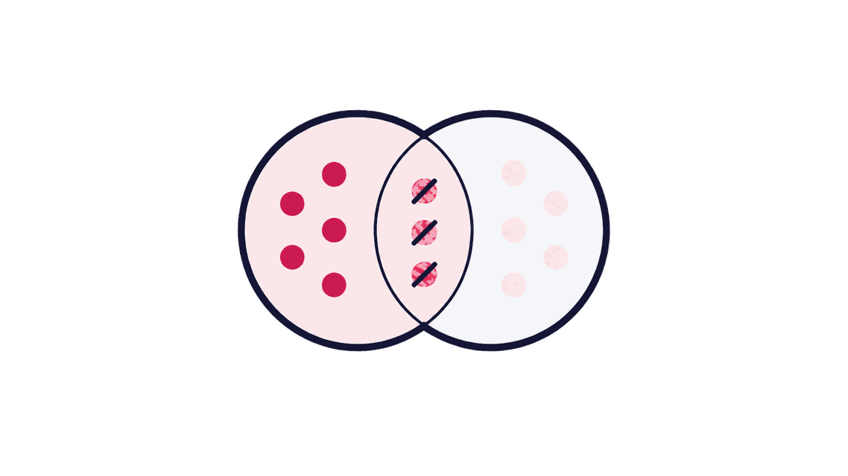
Deduplicate reach across placements and devices
Reconcile exposure where placement and device reporting can be compared. Keep every gap visible before drawing a conclusion from the deduplicated reach estimate. The media lead confirms the deduplicated number before it's used in reporting.
Deduplicated reach estimate with every unreconciled gap left visible.
Build the supported frequency distribution
Break deduplicated reach into a distribution that shows how many people saw the ad once, a few times, or well beyond the cap. The media lead reviews the distribution for anything the average was hiding.
Frequency distribution showing exposure across the deduplicated reach, not only the average.
Flag over- and under-exposed segments
Identify which placements, audiences, or devices are driving excess frequency, and which parts of the intended audience are barely being reached at all. The media lead decides which segments need a real adjustment.
Over- and under-exposure register naming the placements, audiences or devices involved.
Rebalance budget and caps
Adjust budget, caps, or placement mix to correct the over- and under-exposure found, and record what changed and why. The client owner approves any change beyond the pre-agreed adjustment range.
Applied budget, cap or placement-mix change with the evidence recorded.

Re-check the distribution after the change
Confirm that the rebalance moved the distribution in the intended direction. The average alone cannot show that. The media lead signs off on the result or escalates if it didn't work as expected.
Post-change distribution read confirming, or failing to confirm, the intended shift.



What lands with your team
See the exposure pattern behind the average
These artifacts show who was reached, how often and where the reporting has gaps. Each figure links back to the distribution and its coverage.

Frequency distribution report
The full spread of exposure across the campaign's deduplicated reach, with the average kept in context.
Cross-device reach reconciliation
How exposure across placements and devices was deduplicated into one reach number, with any unreconciled gaps stated.

Over/under-exposure register
Which segments, placements, or audiences were driving excess frequency or getting under-reached, and what was done about it.

Rebalance decision log
What budget, cap, or placement changes were made, the evidence behind them, and how the distribution moved afterward.


Before the work starts
When this work is the right next step
The average leaves the exposure pattern out. A campaign can report an average frequency of four while the same person receives twenty impressions and someone else receives none. The distribution reveals that imbalance. If reach isn't deduplicated across placements and devices first, even the average may be wrong.
A good fit when
- The campaign spans several placements or devices, but no deduplicated reach figure shows how much exposure is being counted twice.
- Average frequency sits below the cap, yet nobody can see who saw the ad once and who saw it twenty times.
- Over- and under-served segments are visible in the distribution, so the media owner can tie a cap or budget change to a named exposure problem.
- Frequency gets reported as one average number, with no breakdown of the distribution behind it.
- The same person's exposure across desktop, mobile, and in-app inventory never gets reconciled into one number.
- A frequency cap gets set once at launch from a rule of thumb, without reference to the funnel stage or objective.
- Reach and frequency get optimized separately, so a fix to one quietly makes the other worse.

Better handled as other work when
- One small, single-placement buy has little exposure spread to inspect, so a full frequency distribution would add no useful decision evidence.
- You want a single frequency number proven optimal. No universal rule provides one. The right number depends on the funnel stage and creative.
- Walled or unreported inventory hides placement-level reach and frequency data, so the method cannot build a supported distribution for the whole buy.
People who own a single channel
Paid Search, Paid Social, CRO, and Programmatic each run under a named owner at Zeo. The consultants below are matched to the channel this page is about, so you can see who you'd actually work with.

Serap Yurtvermez
Performance Marketing Team Lead

Abdullah Tanıdır
Performance Marketing Team Lead

Sevda Yurtvermez
Performance Marketing Team Lead

İlker Emir
Senior Performance Marketing Executive

İpek Ezer
Performance Marketing Executive

Onur Durdağı
Performance Marketing Executive

Metehan Urhan
New Business & Partnership Manager
Tools we use
Tools behind this work
 Nielsen ONE
the cross-media currency a flight's deduplicated reach and frequency get checked against
Related work

Parent service
Programmatic, Display & Video Advertising
The frequency envelope and its named approver are agreed there; this method reads the exposure distribution hiding behind that one capped average.

Sibling method
Audience & Data Activation
How the audience being measured for reach and frequency was sourced and activated in the first place.

Sibling method
Placement Quality & Post-Campaign Audit
Where the final reach and frequency distribution gets reconciled into the post-campaign record.


Look past the average frequency
Build the distribution before you rebalance
